MATHEMATICS TEST—CALCULATOR 5

There is no penalty for wrong answers, so it makes sense to give the best answer you can to every question, even if it is just your best guess.

The time is up. You have completed all sections of the SAT.


Math – Calculator Tests

Mathematics Test—Calculator 5

38 Questions. 55 Minutes to Complete. 

Directions

Notes

1. The use of a calculator is permitted.

2. All variables and expressions used represent real numbers unless otherwise indicated.

3. Figures provided in this test are drawn to scale unless otherwise indicated.

4. All figures lie in a plane unless otherwise indicated.

5. Unless otherwise indicated, the domain of a given function f is the set of all real numbers x for which  f (x) is a real number.


For questions 1 through 30, solve each problem, choose the best answer from the choices provided, and fill in the corresponding circle on your answer sheet. For questions 31 through 38, solve the problem and enter your answer in the grid on the answer sheet.

1 / 38

1. Directions

For questions 1 through 30, solve each problem, choose the best answer from the choices provided, and fill in the corresponding circle on your answer sheet. For questions 31 through 38, solve the problem and enter your answer in the grid on the answer sheet. Please refer to the directions before question 31 on how to enter your answers in the grid. You may use scratch paper for scratch work.

Notes

1. The use of a calculator is permitted.

2. All variables and expressions used represent real numbers unless otherwise indicated.

3. Figures provided in this test are drawn to scale unless otherwise indicated.

4. All figures lie in a plane unless otherwise indicated.

5. Unless otherwise indicated, the domain of a given function f is the set of all real numbers x for which f (x) is a real number.

Reference

Begin skippable figure descriptions.

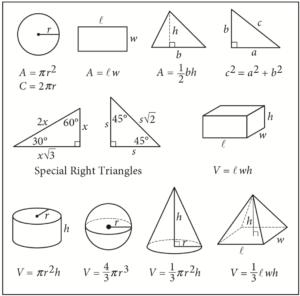
The figure presents information for your reference in solving some of the problems.

Reference figure 1 is a circle with radius r. Two equations are presented below reference figure 1.

A equals pi times the square of r.

C equals 2 pi r.

Reference figure 2 is a rectangle with length  and width w. An equation is presented below reference figure 2.

A equals  w.

Reference figure 3 is a triangle with base b and heighh. An equation is presented below reference figure 3.

A equals onehalf b h.

Reference figure 4 is a right triangle. The two sides that form the right angle are labeled a and b, and the side opposite the right angle is labeled c. An equation is presented below reference figure 4.

c squared equals a squared plus b squared.

Special Right Triangles

Reference figure 5 is a right triangle with a 30degree angle and a 60degree angle. The side opposite the 30degree angle is labeled x. The side opposite the 60degree angle is labeled x times the square root of 3. The side opposite the right angle is labeled 2 x.

Reference figure 6 is a right triangle with two 45degree angles. Two sides are each labeled s. The side opposite the right angle is labeled s times the square root of 2.

Reference figure 7 is a rectangular solid whose base has length  and width w and whose height is h. An equation is presented below reference figure 7.

V equals  w h.

Reference figure 8 is a right circular cylinder whose base has radius r and whose height is h. An equation is presented below reference figure 8.

V equals pi times the square of r times h.

Reference figure 9 is a sphere with radius r. An equation is presented below reference figure 9.

V equals fourthirds pi times the cube of r.

Reference figure 10 is a cone whose base has radius r and whose height is h. An equation is presented below reference figure 10.

V equals onethird times pi times the square of r times h.

Reference figure 11 is an asymmetrical pyramid whose base has length  and width w and whose height is h. An equation is presented below reference figure 11.

V equals onethird  w h.

End skippable figure descriptions.

Additional Reference Information

The number of degrees of arc in a circle is 360.

The number of radians of arc in a circle is 2 pi.

The sum of the measures in degrees of the angles of a triangle is 180.


Question 1 refers to the following table.

Feeding Information for Boarded Pets

Fed only dry food

Fed both wet and dry food

Total

Cats

5

11

16

Dogs

2

23

25

Total

7

34

41

Question 1.

The preceding table shows the kinds of foods that are fed to the cats and dogs currently boarded at a pet care facility. What fraction of the dogs are fed only dry food?

2 / 38

2. Question 2 refers to the following expression.

Question 2.

Which of the following expressions is equivalent to the preceding one?

3 / 38

3. A certain package requires 3 centimeters of tape to be closed securely. What is the maximum number of packages of this type that can be secured with 6 meters of tape? (1 meter equals 100 centimeters)

4 / 38

4. A market researcher selected 200 people at random from a group of people who indicated that they liked a certain book. The 200 people were shown a movie based on the book and then asked whether they liked or disliked the movie. Of those surveyed, 95% said they disliked the movie. Which of the following inferences can appropriately be drawn from this survey result?

5 / 38

5. Which of the following ordered pairs   (x, y) satisfies the inequality   5 x – 3 y < 4?

1  (1, 1)

2  (2, 5)

3  (3, 2)

6 / 38

6. In the equation , a is a constant. If   x = -3 is one solution to the equation, what is a possible value of a?

7 / 38

7. Questions 7 and 8 refer to the following information.

The following scatterplot shows the densities of 7 planetoids, in grams per cubic centimeter, with respect to their average distances from the Sun in astronomical units (A U). The line of best fit is also shown.

Begin skippable figure description.

The figure presents a scatterplot titled “Distance and Density of Planetoids in the Inner Solar System.” The horizontal axis is labeled “Distance from the Sun, in astronomical units (A U),” and the numbers 0 through 3.2, in increments of 0.4, are indicated. The vertical axis is labeled “Density, in grams per cubic centimeter,” and the numbers 3 through 6, in increments of 0.5, are indicated. There are 7 data points. The line of best fit is also drawn. The data points are above and below the line of best fit.

The line of best fit begins at the vertical axis approximately at the point with coordinates 0 comma 5.75. It extends downward and to the right, and ends approximately at the point with coordinates 2.9 comma 3. The line of best fit contains the following points with approximate coordinates:

0.8 comma 5

1.6 comma 4.25

2.4 comma 3.5

End skippable figure description.

Question 7.

According to the scatterplot, which of the following statements is true about the relationship between a planetoid’s average distance from the Sun and its density?

8 / 38

8. An astronomer has discovered a new planetoid about 1.2 A U from the Sun. According to the line of best fit, which of the following best approximates the density of the planetoid, in grams per cubic centimeter?

9 / 38

9. Question 9 refers to the following equation.

  9ax + 9b – 6 = 21

Question 9.

Based on the preceding equation, what is the value of   ax + b?

10 / 38

10. Lani spent 15% of her 8hour workday in meetings. How many minutes of her workday did she spend in meetings?

11 / 38

11. A software company is selling a new game in a standard edition and a collector’s edition. The box for the standard edition has a volume of 20 cubic inches, and the box for the collector’s edition has a volume of 30 cubic inches. The company receives an order for 75 copies of the game, and the total volume of the order to be shipped is 1,870 cubic inches. Which of the following systems of equations can be used to determine the number of standard edition games, s, and collector’s edition games, c, that were ordered?

12 / 38

12. A customer paid $53.00 for a jacket after a 6 percent sales tax was added. What was the price of the jacket before the sales tax was added?

13 / 38

13. Question 13 refers to the following graph.


Begin skippable figure description.

The figure, which presents a graph of 5 line segments, is titled “Theresa’s Running Speed and Time.” The horizontal axis is labeled “Time, in minutes,” and the numbers 0 through 30, in increments of 5, are indicated. The vertical axis is labeled “Speed, in miles per hour,” and the numbers 0 through 8 are indicated. The first line segment begins at the origin and moves upward and to the right until reaching the point with coordinates 5 comma 7. The second line segment begins where the first line segment ends and moves horizontally to the right until reaching the point with coordinates 10 comma 7. The third line segment begins where the second line segment ends and moves downward and to the right ending at the point with coordinates 20 comma 5. The fourth line segment begins where the third line segment ends and moves steadily upward and to the right, ending at the point with coordinates 25 comma 8. The fifth line segment begins where the fourth line segment ends and moves downward and to the right, ending at the horizontal axis at the point with coordinates 30 comma 0.

End skippable figure description.

Question 13.

Theresa ran on a treadmill for thirty minutes, and her time and speed are shown on the preceding graph. According to the graph, which of the following statements is NOT true concerning Theresa’s run?

14 / 38

14. Question 14 refers to the following figure.

Begin skippable figure description.

The figure presents quadrilateral A B C D with horizontal base A D. Each of the 4 angles are labeled. Starting from the bottom left and moving clockwise, angle A is labeled 45 degrees, angle B is labeled x degrees, angle C is labeled x degrees, and angle D is labeled x degrees.

End skippable figure description.

Question 14.

In the preceding figure, what is the value of x?

15 / 38

15. If 50 onecent coins were stacked on top of each other in a column, the column would be approximately  inches tall. At this rate, which of the following is closest to the number of onecent coins it would take to make an 8inchtall column?

16 / 38

16. If   a – b = 12 and  , what is the value of   a + b?

17 / 38

17. Question 17 refers to the following equation.

  y = 19.99 + 1.50 x

Question 17.

The preceding equation models the total cost y, in dollars, that a company charges a customer to rent a truck for one day and drive the truck miles. The total cost consists of a flat fee plus a charge per mile driven. When the equation is graphed in the x yplane, what does the yintercept of the graph represent in terms of the model?

18 / 38

18. Question 18 refers to the following scatterplot.

Begin skippable figure description.

The figure presents a scatterplot titled “Income and Percent of Total Expenses Spent on Programs for Ten Charities in 2011.” The horizontal axis is labeled “Total income, in millions of dollars,” and the numbers 0 through 7,000, in increments of 1,000, are indicated. The vertical axis is labeled “Percent of total expenses spent on programs,” and the numbers 70 through 95, in increments of 5, are indicated. There are 10 data points. The line of best fit is also drawn. The line of best fit begins at approximately the point with coordinates 1,000 comma 80. It extends upward and to the right, and ends at approximately the point with coordinates 6,000 comma 90. The line of best fit passes through the points with the following coordinates. Note that all values are approximate.

2,000 comma 82

3,000 comma 84

4,000 comma 86

5,000 comma 88

The data points are scattered above and below the line of best fit. The data presented by the points are as follows. Note that all values are approximate.

1,100 comma 74

1,500 comma 82

1,550 comma 84

1,550 comma 85

3,200 comma 84

3,400 comma 92

4,200 comma 91

4,500 comma 89

4,500 comma 80

6,000 comma 87

End skippable figure description.

Question 18.

The preceding scatterplot shows data for ten charities along with the line of best fit. For the charity with the greatest percent of total expenses spent on programs, which of the following is closest to the difference of the actual percent and the percent predicted by the line of best fit?

19 / 38

19. Questions 19 and 20 refer to the following information.

The following formulas are used in medicine to estimate the body surface area A, in square meters, of infants and children whose weight w ranges between 3 and 30 kilograms and whose height h is measured in centimeters.

Mosteller’s formula:   

Current’s formula:  

Question 19.

Based on Current’s formula, what is w in terms of A?

20 / 38

20. If Mosteller’s and Current’s formulas give the same estimate for A, which of the following expressions is equivalent to   ?

21 / 38

21. Question 21 refers to the following scatterplot.

Begin skippable figure description.

The figure presents a scatterplot titled “Total Protein and Total Fat for Eight Sandwiches.” The horizontal axis is labeled “Total protein,” in grams, and the numbers 0 through 50, in increments of 10, are indicated. The vertical axis is labeled “Total fat, in grams,” and the numbers 0 through 80, in increments of 10, are indicated. There are 8 data points. The line of best fit is also shown. The data points are scattered above and below the line of best fit. The line of best fit begins at the point with coordinates approximately at 9 comma 17. It extends upward and to the right, and ends at the point with coordinates approximately at 49 comma 75. The line of best fit passes through the points with the following coordinates. Note that all values are approximate.

10 comma 19

20 comma 33

30 comma 48

40 comma 64

End skippable figure description.

Question 21.

The preceding scatterplot shows the numbers of grams of both total protein and total fat for eight sandwiches on a restaurant menu. The line of best fit for the data is also shown. According to the line of best fit, which of the following is closest to the predicted increase in total fat, in grams, for every increase of 1 gram in total protein?

22 / 38

22. Question 22 refers to the following information.

Percent of Residents Who Earned a Bachelor’s Degree or Higher

State

Percent of residents

State A

21.9%

State B

27.9%

State C

25.9%

State D

19.5%

State E

30.1%

State F

36.4%

State G

35.5%

Question 22.

A survey was given to residents of all 50 states asking if they had earned a bachelor’s degree or higher. The results from 7 of the states are given in the preceding table. The median percent of residents who earned a bachelor’s degree or higher for all 50 states was 26.95%. What is the difference between the median percent of residents who earned a bachelor’s degree or higher for these 7 states and the median for all 50 states?

23 / 38

23. A cylindrical can containing pieces of fruit is filled to the top with syrup before being sealed. The base of the can has an area of   75 cm², and the height of the can is 10 centimeters. If   110 cm³ of syrup is needed to fill the can to the top, which of the following is closest to the total volume of the pieces of fruit in the can?

24 / 38

24. Question 24 refers to the following function.

  h(t) = -16t² + 110t + 72

Question 24.

The preceding function models the height h, in feet, of an object above ground seconds after being launched straight up in the air. What does the number 72 represent in the function?

25 / 38

25. Questions 25 and 26 refer to the following information.

The following table gives the typical amounts of energy per gram, expressed in both food calories and kilojoules, of the three macronutrients in food.

Energy per Gram of Typical Macronutrients

Macronutrient

Food calories

Kilojoules

Protein

4.0

16.7

Fat

9.0

37.7

Carbohydrate

4.0

16.7

Question 25.

If food calories is equivalent to kilojoules, of the following, which best represents the relationship between x and k ?

26 / 38

26. If the 180 food calories in a granola bar come entirely from grams of protein, f grams of fat, and grams of carbohydrate, which of the following expresses f in terms of p and c?

27 / 38

27. The world’s population has grown at an average rate of 1.9 percent per year since 1945. There were approximately 4 billion people in the world in 1975. Which of the following functions represents the world’s population P, in billions of people, t years since 1975? (1 billion equals 1,000,000,000.)

28 / 38

28. Question 28 refers to the following figure.

Begin skippable figure description.

The figure presents a line in the xyplane with the origin labeled O. The line is labeled y equals f of x. It begins in quadrant 3 and moves upward and to the right, through the origin, through the point with coordinates 3 comma 6, and ends in quadrant 1.

End skippable figure description.

Question 28.

In the preceding x yplane, a point (not shown) with coordinates   (s, t) lies on the graph of the linear function f. If s and t are positive integers, what is the ratio of t to s?

29 / 38

29. A circle in the x yplane has equation . Which of the following points does NOT lie in the interior of the circle?

30 / 38

30. Question 30 refers to the following table.

Year

Subscriptions sold

2012

5,600

2013

5,880

Question 30.

The manager of an online news service received the preceding report on the number of subscriptions sold by the service. The manager estimated that the percent increase from 2012 to 2013 would be double the percent increase from 2013 to 2014. How many subscriptions did the manager expect would be sold in 2014?

31 / 38

31. Directions

For questions 31 through 38, solve the problem and enter your answer in the grid, as described below, on the answer sheet.

1. Although not required, it is suggested that you write your answer in the boxes at the top of the columns to help you fill in the circles accurately. You will receive credit only if the circles are filled in correctly.

2. Mark no more than one circle in any column.

3. No question has a negative answer.

4. Some problems may have more than one correct answer. In such cases, grid only one answer.

5. Mixed numbers such as must be gridded as 3.5 or 7/2. , is entered into the grid, it will be interpreted as   not

6. Decimal answers: If you obtain a decimal answer with more digits than the grid can accommodate, it may be either rounded or truncated, but it must fill the entire grid.

The following are four examples of how to record your answer in the spaces provided. Keep in mind that there are four spaces provided to record each answer.

Examples 1 and 2

Begin skippable figure description.

Example 1: If your answer is a fraction such as seventwelfths, it should be recorded as follows. Enter 7 in the first space, the fraction bar (a slash) in the second space, 1 in the third space, and 2 in the fourth space. All four spaces would be used in this example.

Example 2: If your answer is a decimal value such as 2.5, it could be recorded as follows. Enter 2 in the second space, the decimal point in the third space, and 5 in the fourth space. Only three spaces would be used in this example.

End skippable figure description.

Example 3


Begin skippable figure description.

Example 3: Acceptable ways to record twothirds are: 2 slash 3, .666, and .667. 

End skippable figure description.

Example 4


Note: You may start your answers in any column, space permitting. Columns you don’t need to use should be left blank.

Begin skippable figure description.

Example 4: It is not necessary to begin recording answers in the first space unless all four spaces are needed. For example, if your answer is 201, you may record 2 in the second space, 0 in the third space, and 1 in the fourth space. Alternatively, you may record 2 in the first space, 0 in the second space, and 1 in the third space. Spaces not needed should be left blank.

End skippable figure description.

Question 31.

In 1854, during the California gold rush, each ounce of gold was worth $20, and the largest known mass of gold found in California was worth $62,400 in that year. What was the weight, in pounds, of this mass of gold? (16 ounces equals 1 pound.)

32 / 38

32. Question 32 refers to the following figure.

Line t is shown in the following x yplane.

Begin skippable figure description.

The figure presents the graph of a line labeled t in the xyplane with the origin labeled O. The numbers negative 10 through 10, in increments of 2, are indicated on each axis. Line t begins in quadrant 3 and moves upward and to the right. It crosses the yaxis at the point with coordinates 0 comma negative 3, crosses the xaxis at the point with coordinates 7.5 comma 0, and ends in quadrant 1. The points with following coordinates are labeled on line t.

Negative 6, comma, the negative fraction 27 over 5.

The fraction 5 over 2 comma negative 2.

9 comma the fraction 3 over 5.

End skippable figure description.

Question 32.

What is the slope of line t?

33 / 38

33. The score on a trivia game is obtained by subtracting the number of incorrect answers from twice the number of correct answers. If a player answered 40 questions and obtained a score of 50, how many questions did the player answer correctly?

34 / 38

34. Question 34 refers to the following figure.

Begin skippable figure description.

The figure presents a circle with center C. Two radii are drawn in the circle forming an angle of 100 degrees. The region bound by the two radii and the edge of the circle containing the angle of 100 degrees is shaded.

End skippable figure description.

Question 34.

Point C is the center of the preceding circle. What fraction of the area of the circle is the area of the shaded region?

35 / 38

35. Question 35 refers to the following system of equations.


y = x – 4 x + 4

y = 4 – x

Question 35.

If the ordered pair   (x, y) satisfies the preceding system of equations, what is one possible value of x?

36 / 38

36. Question 36 refers to the following figure.

Begin skippable figure description.

The figure presents right triangle A B C, with horizontal side A C. Point B is directly above point A and angle A is a right angle. Point D lies on side A B and point E lies on side B C. Horizontal line segment D E is drawn and angle D is a right angle.

End skippable figure description.

Question 36.

In the preceding figure . If BC = 15 and   D A = 4, what is the length of  ?

37 / 38

37. Questions 37 and 38 refer to the following information.

The same 20 contestants, on each of 3 days, answered 5 questions in order to win a prize. Each contestant received 1 point for each correct answer. The number of contestants receiving a given score on each day is shown in the following table.

Number of Contestants by Score and Day

5 out of 5

4 out of 5

3 out of 5

2 out of 5

1 out of 5

0 out of 5

Total

Day 1

2

3

  4

  6

2

3

20

Day 2

2

3

  5

  5

4

1

20

Day 3

3

3

  4

  5

3

2

20

Total

7

9

13

16

9

6

60

Question 37.

What was the mean score of the contestants on Day 1?

38 / 38

38. No contestant received the same score on two different days. If a contestant is selected at random, what is the probability that the selected contestant received a score of 5 on Day 2 or Day 3, given that the contestant received a score of 5 on one of the three days?

Shopping cart0
There are no products in the cart!
Continue shopping
0