MATHEMATICS TEST—CALCULATOR 7

There is no penalty for wrong answers, so it makes sense to give the best answer you can to every question, even if it is just your best guess.

The time is up. You have completed all sections of the SAT.


Math – Calculator Tests

Mathematics Test—Calculator 7

38 Questions. 55 Minutes to Complete. 

Directions

Notes

1. The use of a calculator is permitted.

2. All variables and expressions used represent real numbers unless otherwise indicated.

3. Figures provided in this test are drawn to scale unless otherwise indicated.

4. All figures lie in a plane unless otherwise indicated.

5. Unless otherwise indicated, the domain of a given function f is the set of all real numbers x for which  f (x) is a real number.


For questions 1 through 30, solve each problem, choose the best answer from the choices provided, and fill in the corresponding circle on your answer sheet. For questions 31 through 38, solve the problem and enter your answer in the grid on the answer sheet.

1 / 38

1. Directions

For questions 1 through 30, solve each problem, choose the best answer from the choices provided, and fill in the corresponding circle on your answer sheet. For questions 31 through 38, solve the problem and enter your answer in the grid on the answer sheet. Please refer to the directions before question 31 on how to enter your answers in the grid. You may use scratch paper for scratch work.

Notes

1. The use of a calculator is permitted.

2. All variables and expressions used represent real numbers unless otherwise indicated.

3. Figures provided in this test are drawn to scale unless otherwise indicated.

4. All figures lie in a plane unless otherwise indicated.

5. Unless otherwise indicated, the domain of a given function f is the set of all real numbers x for which f (x) is a real number.

Reference

Begin skippable figure descriptions.

The figure presents information for your reference in solving some of the problems.

Reference figure 1 is a circle with radius r. Two equations are presented below reference figure 1.

A equals pi times the square of r.

C equals 2 pi r.

Reference figure 2 is a rectangle with length  and width w. An equation is presented below reference figure 2.

A equals  w.

Reference figure 3 is a triangle with base b and heighh. An equation is presented below reference figure 3.

A equals onehalf b h.

Reference figure 4 is a right triangle. The two sides that form the right angle are labeled a and b, and the side opposite the right angle is labeled c. An equation is presented below reference figure 4.

c squared equals a squared plus b squared.

Special Right Triangles

Reference figure 5 is a right triangle with a 30degree angle and a 60degree angle. The side opposite the 30degree angle is labeled x. The side opposite the 60degree angle is labeled x times the square root of 3. The side opposite the right angle is labeled 2 x.

Reference figure 6 is a right triangle with two 45degree angles. Two sides are each labeled s. The side opposite the right angle is labeled s times the square root of 2.

Reference figure 7 is a rectangular solid whose base has length  and width w and whose height is h. An equation is presented below reference figure 7.

V equals  w h.

Reference figure 8 is a right circular cylinder whose base has radius r and whose height is h. An equation is presented below reference figure 8.

V equals pi times the square of r times h.

Reference figure 9 is a sphere with radius r. An equation is presented below reference figure 9.

V equals fourthirds pi times the cube of r.

Reference figure 10 is a cone whose base has radius r and whose height is h. An equation is presented below reference figure 10.

V equals onethird times pi times the square of r times h.

Reference figure 11 is an asymmetrical pyramid whose base has length  and width w and whose height is h. An equation is presented below reference figure 11.

V equals onethird  w h.

End skippable figure descriptions.

Additional Reference Information

The number of degrees of arc in a circle is 360.

The number of radians of arc in a circle is 2 pi.

The sum of the measures in degrees of the angles of a triangle is 180.

Question 1.

What value of x satisfies the equation   3 x + 3 = 27?

2 / 38

2. Two units of length used in ancient Egypt were cubits and palms, where 1 cubit is equivalent to 7 palms. The Great Sphinx statue in Giza is approximately 140 cubits long. Which of the following best approximates the length, in palms, of the Great Sphinx statue?

3 / 38

3. If , what is the value of 2 n – 1?

4 / 38

4. Question 4 is based on the following equation.

Question 4.

Which of the following values of x is NOT a solution to the preceding equation?

5 / 38

5. Questions 5 and 6 are based on the following information.

In an experiment, a heated cup of coffee is removed from a heat source, and the cup of coffee is then left in a room that is kept at a constant temperature. The following graph shows the temperature, in degrees Fahrenheit, of the coffee immediately after being removed from the heat source and at 10minute intervals thereafter.

Begin skippable figure description.

The figure presents a scatterplot titled “Temperature of a Cup of Coffee during an Experiment.” The horizontal axis is labeled “Time since cup was removed from heat source, in minutes,” and the numbers 0 through 140, in increments of 20, are indicated. The vertical axis is labeled “Temperature, in degrees Fahrenheit,” and the numbers 0 through 220, in increments of 20, are indicated. There are 15 data points in the scatterplot. The data points begin with point 0 comma 195, and trend downward and to the right, rapidly at first, then more and more slowly, finally leveling off. The last data point is 140 comma 76.

The 15 data points are as follows. The second coordinate of each point is approximate.

Point 1, 0 comma 195.

Point 2, 10 comma 153.

Point 3, 20 comma 136.

Point 4, 30 comma 122.

Point 5, 40 comma 109.

Point 6, 50 comma 100.

Point 7, 60 comma 92.

Point 8, 70 comma 84.

Point 9, 80 comma 82.

Point 10, 90 comma 80.

Point 11, 100 comma 79.

Point 12, 110 comma 77.

Point 13, 120 comma 77.

Point 14, 130 comma 76.

Point 15, 140 comma 76.

End skippable figure description.

Question 5.

Of the following, which best approximates the temperature, in degrees Fahrenheit, of the coffee when it is first removed from the heat source?

6 / 38

6. During which of the following 10minute intervals does the temperature of the coffee decrease at the greatest average rate?

7 / 38

7. Question 7 is based on the following figure.

Begin skippable figure description.

The figure presents line segments A D and B E intersecting at point C. Line segments A B and D E together with line segments A D and B E form two triangles, A B C and C D E. In triangle A B C, angle A measures 20 degrees, angle B measures x degrees, and the measure of angle C is not given. In triangle C D E, angle D measures y degrees, angle E measures 40 degrees, and the measure of angle C is not given. Angle C of triangle A B C appears to be congruent to angle C of triangle C D E. A note states that the figure is not drawn to scale.

End skippable figure description.

Question 7.

In the preceding figure, intersects at C. If   x = 100, what is the value of y?

8 / 38

8. Question 8 is based on the following information.

The line graphed in the following x yplane models the total cost, in dollars, for a cab ride, y, in a certain city during nonpeak hours based on the number of miles traveled, x.

Begin skippable figure description.

The figure presents the graph of a line in the x yplane titled “Total Cost for a Cab Ride.” The xaxis is labeled “Distance traveled, in miles,” and the integers 0, 5, and 10 are indicated. There are vertical gridlines at each integer from 1 through 10. The yaxis is labeled “Cost, in dollars,” and the integers 0, 5, 10, and 15 are indicated. There are horizontal gridlines at each integer from 1 through 15. The line begins on the yaxis at the point with coordinates 0 comma 3, and slants upward and to the right. It passes through the point with coordinates 5 comma 13.

End skippable figure description.

Question 8.

According to the graph, what is the cost for each additional mile traveled, in dollars, of a cab ride?

9 / 38

9. Question 9 is based on the following table.

Customer Purchases at a Gas Station

Beverage purchased

Beverage not purchased

Total

Gasoline purchased

60

25

85

Gasoline not purchased

35

15

50

Total

95

40

135

Question 9.

On Tuesday, a local gas station had 135 customers. The preceding table summarizes whether or not the customers on Tuesday purchased gasoline, a beverage, both, or neither. Based on the data in the table, what is the probability that a gas station customer selected at random on that day did not purchase gasoline?

10 / 38

10. Question 10.

Washington High School randomly selected freshman, sophomore, junior, and senior students for a survey about potential changes to next year’s schedule. Of students selected for the survey,   one fourth were freshmen and   one third were sophomores. Half of the remaining selected students were juniors. If 336 students were selected for the survey, how many were seniors?

11 / 38

11. Plant A is currently 20 centimeters tall, and Plant B is currently 12 centimeters tall. The ratio of the heights of Plant A to Plant B is equal to the ratio of the heights of Plant C to Plant D. If Plant C is 54 centimeters tall, what is the height of Plant D, in centimeters?

12 / 38

12. Biologists found a new species of pale shrimp at the world’s deepest undersea vent, the Beebe Vent Field. The vent is 3.1 miles below the sea’s surface. Approximately how many kilometers below the sea’s surface is the vent? (1 kilometer is approximately equal to 0.6214 miles)

13 / 38

13. A cargo helicopter delivers only 100pound packages and 120pound packages. For each delivery trip, the helicopter must carry at least 10 packages, and the total weight of the packages can be at most 1,100 pounds. What is the maximum number of 120pound packages that the helicopter can carry per trip?

14 / 38

14. A company purchased a machine valued at $120,000. The value of the machine depreciates by the same amount each year so that after 10 years the value will be $30,000. Which of the following equations gives the value, v, of the machine, in dollars, t years after it was purchased for 0t ≤ 10?

15 / 38

15. Line m in the x yplane contains the points  (2, 4)and  (0, 1). Which of the following is an equation of line m?

16 / 38

16. Question 16 is based on the following expression.

Question 16.

In the preceding expression, a is a constant. If the expression is equivalent to b x, where b is a constant, what is the value of b?

17 / 38

17. If   2 w + 4, t = 14 and   4 w + 5 t = 25, what is the value of   2 w + 3 t?

18 / 38

18. Questions 18 through 20 are based on the following information.

Jennifer bought a box of Crunchy Grain cereal. The nutrition facts on the box state that a serving size of the cereal is three fourths cup and provides 210 calories, 50 of which are calories from fat. In addition, each serving of the cereal provides 180 milligrams of potassium, which is 5% of the daily allowance for adults.

Question 18.

If p percent of an adult’s daily allowance of potassium is provided by x servings of Crunchy Grain cereal per day, which of the following expresses p in terms of x ?

19 / 38

19. On Tuesday, Jennifer will mix Crunchy Grain cereal with Super Grain cereal for her breakfast. Super Grain cereal provides 240 calories per cup. If the total number of calories in one cup of Jennifer’s mixture is 270, how much Super Grain cereal is in one cup of the mixture?

20 / 38

20. Which of the following could be the graph of the number of calories from fat in Crunchy Grain cereal as a function of the number of   three fourths cup servings of the cereal?

Each answer choice presents the graph of a line in the coordinate plane, with the origin labeled O. The horizontal axis is labeled “Number of three fourths cup servings.” The vertical axis is labeled “Calories from fat.”

21 / 38

21. The graph of the exponential function h in the x yplane, where   y = h(x), has a yintercept of d, where d is a positive constant. Which of the following could define the function h?

22 / 38

22. The weights, in pounds, for 15 horses in a stable were reported, and the mean, median, range, and standard deviation for the data were found. The horse with the lowest reported weight was found to actually weigh 10 pounds less than its reported weight. What value remains unchanged if the four values are reported using the corrected weight?

23 / 38

23. Near the end of a U S cable news show, the host invited viewers to respond to a poll on the show’s website that asked, “Do you support the new federal policy discussed during the show?” At the end of the show, the host reported that 28% responded “Yes,” and 70% responded “No.” Which of the following best explains why the results are unlikely to represent the sentiments of the population of the United States?

24 / 38

24. If   and , what is the value of a?

25 / 38

25. If sinx° = a, which of the following must be true for all values of x?

26 / 38

26. Question 26 is based on the following function.

h(x) = -16x² + 100x + 10 

Question 26.

The preceding quadratic function models the height above the ground h, in feet, of a projectile x seconds after it had been launched vertically. If   y = h (x) is graphed in the x yplane, which of the following represents the reallife meaning of the positive xintercept of the graph?

27 / 38

27. In the x yplane, the graph of the polynomial function f crosses the xaxis at exactly two points,  (a, 0) and  (b, 0), where a and b are both positive. Which of the following could define f ?

28 / 38

28. If y = 3x² + 6x + 2 is graphed in the x yplane, which of the following characteristics of the graph is displayed as a constant or coefficient in the equation?

29 / 38

29. The preceding scatterplot shows the federalmandated minimum wage every 10 years between 1940 and 2010. A line of best fit is shown, and its equation is   y = 0.096 x – 0.488. What does the line of best fit predict about the increase in the minimum wage over the 70year period?

30 / 38

30. Question 30 is based on the following figure.

Begin skippable figure description.

The figure presents a scatterplot titled “Ice Cream Sales.” The horizontal axis is labeled “Temperature, in degrees Celsius,” and the integers 10 through 26, in increments of 2, are indicated. The vertical axis is labeled “Sales, in dollars,” and the integers 300 through 1,000, in increments of 100, are indicated. There are 12 data points in the scatterplot, and the line of best fit is drawn. The line of best fit begins slightly above the horizontal axis, and slightly to the right of the vertical axis, and slants upward and to the right. It passes through the point 12 comma 480 and the point 24 comma 880.

End skippable figure description.

Question 30.

The preceding scatterplot shows a company’s ice cream sales d, in dollars, and the high temperature t, in degrees Celsius, on 12 different days. A line of best fit for the data is also shown. Which of the following could be an equation of the line of best fit?

31 / 38

31. Directions

For questions 31 through 38, solve the problem and enter your answer in the grid, as described below, on the answer sheet.

1. Although not required, it is suggested that you write your answer in the boxes at the top of the columns to help you fill in the circles accurately. You will receive credit only if the circles are filled in correctly.

2. Mark no more than one circle in any column.

3. No question has a negative answer.

4. Some problems may have more than one correct answer. In such cases, grid only one answer.

5. Mixed numbers such as must be gridded as 3.5 or 7/2. 
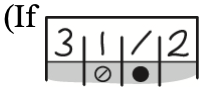
, is entered into the grid, it will be interpreted as   not

6. Decimal answers: If you obtain a decimal answer with more digits than the grid can accommodate, it may be either rounded or truncated, but it must fill the entire grid.

The following are four examples of how to record your answer in the spaces provided. Keep in mind that there are four spaces provided to record each answer.

Examples 1 and 2

Begin skippable figure description.

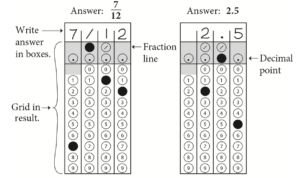
Example 1: If your answer is a fraction such as seventwelfths, it should be recorded as follows. Enter 7 in the first space, the fraction bar (a slash) in the second space, 1 in the third space, and 2 in the fourth space. All four spaces would be used in this example.

Example 2: If your answer is a decimal value such as 2.5, it could be recorded as follows. Enter 2 in the second space, the decimal point in the third space, and 5 in the fourth space. Only three spaces would be used in this example.

End skippable figure description.

Example 3


Begin skippable figure description.

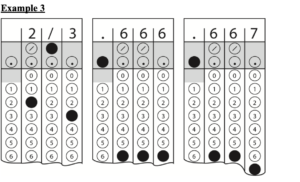
Example 3: Acceptable ways to record twothirds are: 2 slash 3, .666, and .667. 

End skippable figure description.

Example 4


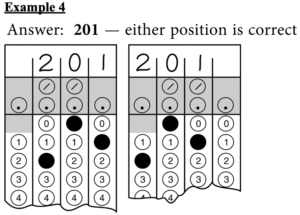
Note: You may start your answers in any column, space permitting. Columns you don’t need to use should be left blank.

Begin skippable figure description.

Example 4: It is not necessary to begin recording answers in the first space unless all four spaces are needed. For example, if your answer is 201, you may record 2 in the second space, 0 in the third space, and 1 in the fourth space. Alternatively, you may record 2 in the first space, 0 in the second space, and 1 in the third space. Spaces not needed should be left blank.

End skippable figure description.

Question 31 is based on the following figure.

Begin skippable figure description.

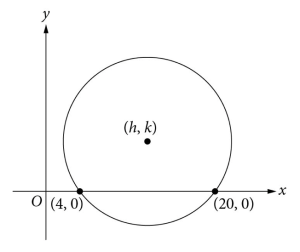
The figure presents a circle in the x yplane, with the origin labeled O. The center of the circle is above the xaxis and to the right of the yaxis. The coordinates of the center of the circle are h comma k. The circle crosses the xaxis at the point with coordinates 4 comma 0, and the point with coordinates 20 comma 0.

End skippable figure description.

Question 31.

In the preceding x yplane, the circle has center   (h, k) and radius 10. What is the value of k?

32 / 38

32. In the x yplane, line l has a yintercept of   13 and is perpendicular to the line with equation . If the point  (10, b) is on line l, what is the value of b?

33 / 38

33. Question 33 is based on the following table.

Begin skippable figure description.

The figure presents a 5 column table. The heading for column 1 is “Rhesus factor.” The heading above columns 2 through 5 is “Blood type.” The heading for column 2 is “A.” The heading for column 3 is “B.” The heading for column 4 is “A B.” The heading for column 5 is “O.” There are 2 rows of data in the table. The data are as follows.

Row 1. Rhesus factor, positive. Blood type, A, 33. Blood type, B, 9. Blood type, A B, 3. Blood type, O, 37.

Row 2. Rhesus factor, negative. Blood type, A, 7. Blood type, B, 2. Blood type, A B, 1. Blood type, O, x.

End skippable figure description.

Question 33.

Human blood can be classified into four common blood types—A, B, A B, and O. It is also characterized by the presence (positive) or absence (negative) of the rhesus factor. The preceding table shows the distribution of blood type and rhesus factor for a group of people. If one of these people who is rhesus negative is chosen at random, the probability that the person has blood type B is   one ninth. What is the value of x?

34 / 38

34. Question 34 is based on the following figure.

Begin skippable figure description.

The figure presents a bar graph titled “Number of Goals Scored by a Soccer Team in 29 Games.” The horizontal axis is labeled “Number of goals scored,” and the integers 0 through 7 are indicated. The vertical axis is labeled “Number of games,” and the integers 0 through 10 are indicated. The data represented by the 6 bars are as follows.

Bar 1. Number of goals scored, 1. Number of games, 8.

Bar 2. Number of goals scored, 2. Number of games, 9.

Bar 3. Number of goals scored, 3. Number of games, 6.

Bar 4. Number of goals scored, 4. Number of games, 3.

Bar 5. Number of goals scored, 5. Number of games, 2.

There is no bar. Number of goals scored, 6. Number of games, 0.

Bar 6. Number of goals scored, 7. Number of games, 1.

End skippable figure description.

Question 34.

Based on the preceding graph, in how many of the games played did the soccer team score goals equal to the median number of goals for the 29 games?

35 / 38

35. Gisela would owe $15,500 in taxes each year if she were not eligible for any tax deductions. This year, Gisela is eligible for tax deductions that reduce the amount of taxes she owes by $2,325.00. If these tax deductions reduce the taxes Gisela owes this year by d%, what is the value of d ?

36 / 38

36. Question 36 is based on the following two equations.

ax – by = 9 

Question 36.

The preceding system of equations has no solutions. If a and b are constants, what is the value of  ?

37 / 38

37. Questions 37 and 38 are based on the following information.

The following table shows the number of international tourist arrivals, rounded to the nearest tenth of a million, to the top nine tourist destinations in both 2012 and 2013.

International Tourist Arrivals, in millions

Country

2012

2013

France

83.0

84.7

United States

66.7

69.8

Spain

57.5

60.7

China

57.7

55.7

Italy

46.4

47.7

Turkey

35.7

37.8

Germany

30.4

31.5

United Kingdom

26.3

32.2

Russia

24.7

28.4

Question 37.

Based on the information given in the table, how much greater, in millions, was the median number of international tourist arrivals to the top nine tourist destinations in 2013 than the median number in 2012, to the nearest tenth of a million?

38 / 38

38. The number of international tourist arrivals in Russia in 2012 was 13.5% greater than in 2011. The number of international tourist arrivals in Russia was k million more in 2012 than in 2011. What is the value of k to the nearest integer?

Shopping cart0
There are no products in the cart!
Continue shopping
0