MATHEMATICS TEST—CALCULATOR 6

There is no penalty for wrong answers, so it makes sense to give the best answer you can to every question, even if it is just your best guess.

The time is up. You have completed all sections of the SAT.


Math – Calculator Tests

Mathematics Test—Calculator 6

38 Questions. 55 Minutes to Complete. 

Directions

Notes

1. The use of a calculator is permitted.

2. All variables and expressions used represent real numbers unless otherwise indicated.

3. Figures provided in this test are drawn to scale unless otherwise indicated.

4. All figures lie in a plane unless otherwise indicated.

5. Unless otherwise indicated, the domain of a given function f is the set of all real numbers x for which  f (x) is a real number.


For questions 1 through 30, solve each problem, choose the best answer from the choices provided, and fill in the corresponding circle on your answer sheet. For questions 31 through 38, solve the problem and enter your answer in the grid on the answer sheet.

1 / 38

1. Directions

For questions 1 through 30, solve each problem, choose the best answer from the choices provided, and fill in the corresponding circle on your answer sheet. For questions 31 through 38, solve the problem and enter your answer in the grid on the answer sheet. Please refer to the directions before question 31 on how to enter your answers in the grid. You may use scratch paper for scratch work.

Notes

1. The use of a calculator is permitted.

2. All variables and expressions used represent real numbers unless otherwise indicated.

3. Figures provided in this test are drawn to scale unless otherwise indicated.

4. All figures lie in a plane unless otherwise indicated.

5. Unless otherwise indicated, the domain of a given function f is the set of all real numbers x for which f (x) is a real number.

Reference

Begin skippable figure descriptions.

The figure presents information for your reference in solving some of the problems.

Reference figure 1 is a circle with radius r. Two equations are presented below reference figure 1.

A equals pi times the square of r.

C equals 2 pi r.

Reference figure 2 is a rectangle with length  and width w. An equation is presented below reference figure 2.

A equals  w.

Reference figure 3 is a triangle with base b and heighh. An equation is presented below reference figure 3.

A equals onehalf b h.

Reference figure 4 is a right triangle. The two sides that form the right angle are labeled a and b, and the side opposite the right angle is labeled c. An equation is presented below reference figure 4.

c squared equals a squared plus b squared.

Special Right Triangles

Reference figure 5 is a right triangle with a 30degree angle and a 60degree angle. The side opposite the 30degree angle is labeled x. The side opposite the 60degree angle is labeled x times the square root of 3. The side opposite the right angle is labeled 2 x.

Reference figure 6 is a right triangle with two 45degree angles. Two sides are each labeled s. The side opposite the right angle is labeled s times the square root of 2.

Reference figure 7 is a rectangular solid whose base has length  and width w and whose height is h. An equation is presented below reference figure 7.

V equals  w h.

Reference figure 8 is a right circular cylinder whose base has radius r and whose height is h. An equation is presented below reference figure 8.

V equals pi times the square of r times h.

Reference figure 9 is a sphere with radius r. An equation is presented below reference figure 9.

V equals fourthirds pi times the cube of r.

Reference figure 10 is a cone whose base has radius r and whose height is h. An equation is presented below reference figure 10.

V equals onethird times pi times the square of r times h.

Reference figure 11 is an asymmetrical pyramid whose base has length  and width w and whose height is h. An equation is presented below reference figure 11.

V equals onethird  w h.

End skippable figure descriptions.

Additional Reference Information

The number of degrees of arc in a circle is 360.

The number of radians of arc in a circle is 2 pi.

The sum of the measures in degrees of the angles of a triangle is 180.

Question 1.

One pound of grapes costs $2. At this rate, how many dollars will pounds of grapes cost?

2 / 38

2. Question 2 refers to the following information.

Tracy collects, sells, and trades figurines, and she tracks the number of figurines in her collection on the following graph.

Begin skippable figure description.

The figure presents a graph consisting of 5 line segments in the coordinate plane. The horizontal axis is labeled “Time, in months,” and the numbers 1 through 5 are indicated. The vertical axis is labeled “Number of figurines.” There are no numbers indicated on the vertical axis. The first line segment begins slightly above the horizontal axis at 0 months and moves gradually up and to the right, ending at 1 month and to the right of the vertical axis, where the second line segment begins. The second line segment begins at 1 month and glides downward and to the right, ending at 2 months, where the third line segment begins. The third line segment begins at 2 months and moves quickly upward and to the right, ending at 3 months, where the fourth line segment begins. The fourth line segment begins at 3 months and moves steeply downward and to the right, ending at 4 months, where the fifth line segment begins. The fifth line segment begins at 4 months and moves steeply upward and to the right.

End skippable figure description.

Question 2.

On what interval did the number of figurines decrease the fastest?

3 / 38

3. In a random sample of 200 cars of a particular model, 3 have a manufacturing defect. At this rate, how many of 10,000 cars of the same model will have a manufacturing defect?

4 / 38

4. Question 4 refers to the following figure.

Begin skippable figure description.

The figure, which presents a scatterplot in the x yplane, is titled “Dimensions of Iris Petals.” The xaxis is labeled “Width, in millimeters,” and the numbers 8 through 18, in increments of 2, are indicated. The yaxis is labeled “Length, in millimeters,” and the numbers 25 through 60, in increments of 5, are indicated. There is a cluster of data points, and the line of best fit, with the equation y equals 1.67 x, plus 21.1, is also drawn.

End skippable figure description.

Question 4.

The preceding scatterplot shows data collected on the lengths and widths of Iris setosa petals. A line of best fit for the data is also shown. Based on the line of best fit, if the width of an Iris setosa petal is 19 millimeters, what is the predicted length, in millimeters, of the petal?

5 / 38

5. Question 5 refers to the following figure.


Begin skippable figure description.

The figure presents 2 parallel lines l and m, which are almost horizontal, with l above m. A line segment from the left on m, moves up and to the right, intersects, and ends above l. Another line segment from the right on m, moves up and to the left, intersects, and ends at the same point as the other line segment, above l. The angle at the point where the two line segments meet is labeled x degrees. The angle above l and to the left of the right line segment is labeled z degrees. The angle above m and to the right of the left line segment is labeled y degrees. The figure is not drawn to scale.

End skippable figure description.

Question 5.

In the preceding figure, lines   l and m are parallel,   y = 20, and   z = 60. What is the value of x?

6 / 38

6. Two types of tickets were sold for a concert held at an amphitheater. Tickets to sit on a bench during the concert cost $75 each, and tickets to sit on the lawn during the concert cost $40 each. Organizers of the concert announced that 350 tickets had been sold and that $19,250 had been raised through ticket sales alone. Which of the following systems of equations could be used to find the number of tickets for bench seats, B, and the number of tickets for lawn seats, L, that were sold for the concert?

Each choice consists of a system of two equations.

7 / 38

7. In the x yplane, the graph of which of the following equations is a line with a slope of 3?

8 / 38

8. Question 8 refers to the following equation.

Question 8.

In the preceding equation, which of the following is a possible value of   x +1?

9 / 38

9. Questions 9 through 11 refer to the following information.

The glass pictured in the following figure can hold a maximum volume of 473 cubic centimeters, which is approximately 16 fluid ounces.

Begin skippable figure description.

The figure presents a cylindrical shape with a circular base and a larger circular top. The diameter of the circular base is labeled “k over 2,” the diameter of the circular top is labeled “k,” and the height is labeled “k.” The volume of the figure is equal to the fraction with numerator 7 pi k cubed, and denominator 48.

End skippable figure description.

Question 9.

What is the value of k, in centimeters?

10 / 38

10. Water pours into the glass slowly and at a constant rate. Which of the following graphs best illustrates the height of the water level in the glass as it fills?

Each answer choice presents the graph of a curve in a coordinate plane. The horizontal axis is labeled “Time.” The vertical axis is labeled “Height of water level.”

11 / 38

11. Jenny has a pitcher that contains 1 gallon of water. How many times could Jenny completely fill the glass with 1 gallon of water? (1 gallon equals 128 fluid ounces.)

12 / 38

12. Roberto is an insurance agent who sells two types of policies: a $50,000 policy and a $100,000 policy. Last month, his goal was to sell at least 57 insurance policies. While he did not meet his goal, the total value of the policies he sold was over $3,000,000. Which of the following systems of inequalities describes x, the possible number of $50,000 policies, and y, the possible number of $100,000 policies, that Roberto sold last month?

Each choice consists of a system of two inequalities.

13 / 38

13. If , where   a > 0, what is a in terms of x?

14 / 38

14. Which of the following is a value of x for which the expression   is undefined?

15 / 38

15. A granite block in the shape of a right rectangular prism has dimensions 30 centimeters by 40 centimeters by 50 centimeters. The block has a density of 2.8 grams per cubic centimeter. What is the mass of the block, in grams? (Density is mass per unit volume.)

16 / 38

16. The preceding table shows the results of a research study that investigated the therapeutic value of vitamin C in preventing colds. A random sample of 300 adults received either a vitamin C pill or a sugar pill each day during a 2week period, and the adults reported whether they contracted a cold during that time period. What proportion of adults who received a sugar pill reported contracting a cold?

17 / 38

17. Question 17 refers to the following table.

Ages of 20 Students Enrolled in a College Class

Age

Frequency

18

6

19

5

20

4

21

2

22

1

23

1

30

1

Question 17.

The preceding table shows the distribution of ages of the 20 students enrolled in a college class. Which of the following gives the correct order of the mean, median, and mode of the ages?

18 / 38

18. Question 18 refers to the following information.

The following figure shows the relationship between the percent of leaf litter mass remaining after decomposing for 3 years and the mean annual temperature, in degrees Celsius, in 18 forests in Canada. A line of best fit is also shown.

Begin skippable figure description.

The figure presents a scatterplot in the coordinate plane. The horizontal axis is labeled “Mean annual temperature, in degrees Celsius,” and the numbers negative 10 through 10, in increments of 5, are indicated. The vertical axis is labeled “Leaf litter mass remaining, in percent,” and the numbers 40 through 100, in increments of 10, are indicated. There are 18 data points in the scatterplot and the line of best fit is also drawn. The line goes through the points with coordinates approximately equal to negative 5 comma 76, and 0 comma 65.

End skippable figure description.

Question 18.

A particular forest in Canada, whose data is not included in the preceding figure, had a mean annual temperature of   negative 2 degrees Celsius. Based on the line of best fit, which of the following is closest to the predicted percent of leaf litter mass remaining in this particular forest after decomposing for 3 years?

19 / 38

19. The range of the polynomial function f is the set of real numbers less than or equal to 4. If the zeros of f are  3 and 1, which of the following could be the graph of   y = f(x) in the x yplane?

Each answer choice presents a curve in the x yplane. The numbers negative 6 and 6 are indicated on both the xaxis and the yaxis.

20 / 38

20. The average annual energy cost for a certain home is $4,334. The homeowner plans to spend $25,000 to install a geothermal heating system. The homeowner estimates that the average annual energy cost will then be $2,712. Which of the following inequalities can be solved to find t, the number of years after installation at which the total amount of energy cost savings will exceed the installation cost?

21 / 38

21. Questions 21 and 22 refer to the following information.

Between 1985 and 2003, data were collected every three years on the amount of plastic produced annually in the United States, in billions of pounds. The following graph shows the data and a line of best fit. The equation of the line of best fit is   y = 3.39 x = 46.89, where x is the number of years since 1985 and y is the amount of plastic produced annually, in billions of pounds.

Begin skippable figure description.

The figure presents a scatterplot titled “U S Production of Plastic” in the coordinate plane. The horizontal axis is labeled “Number of years since 1985,” and the numbers 0 through 20, in increments of 2, are indicated. The vertical axis is labeled “Amount of plastic, in billions of pounds,” and the numbers 0 through 120, in increments of 20, are indicated. There are 7 data points in the scatterplot and the line of best fit is also drawn. The line goes through the points with coordinates approximately equal to 15 comma 98 and 18 comma 108.

End skippable figure description.

Question 21.

Which of the following is the best interpretation of the number 3.39 in the context of the problem?

22 / 38

22. Which of the following is closest to the percent increase in the billions of pounds of plastic produced in the United States from 2000 to 2003?

23 / 38

23. Question 23 refers to the following equation.

Question 23.

The preceding equation models the number of members, M, of a gym t years after the gym opens. Of the following, which equation models the number of members of the gym q quarter years after the gym opens?

24 / 38

24. For the finale of a T V show, viewers could use either social media or a text message to vote for their favorite of two contestants. The contestant receiving more than 50% of the vote won. An estimated 10% of the viewers voted, and 30% of the votes were cast on social media. Contestant 2 earned 70% of the votes cast using social media and 40% of the votes cast using a text message. Based on this information, which of the following is an accurate conclusion?

25 / 38

25. Question 25 refers to the following table.

Population of Greenleaf, Idaho

Year

Population

2000

862

2010

846

Question 25.

The preceding table shows the population of Greenleaf, Idaho, for the years 2000 and 2010. If the relationship between population and year is linear, which of the following functions P models the population of Greenleaf t years after 2000?

26 / 38

26. To determine the mean number of children per household in a community, Tabitha surveyed 20 families at a playground. For the 20 families surveyed, the mean number of children per household was 2.4. Which of the following statements must be true?

27 / 38

27. In the x yplane, the point   (p, r) lies on the line with equation   y = x + b, where b is a constant. The point with coordinates   (2 p, 5 r) lies on the line with equation   y = 2 x + b. If   p0, what is the value of  ?

28 / 38

28. Question 28 refers to the following information.

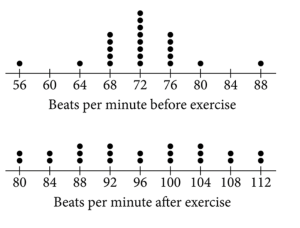
The 22 students in a health class conducted an experiment in which they each recorded their pulse rates, in beats per minute, before and after completing a light exercise routine. The following dot plots display the results.


Begin skippable figure description.

The figure presents 2 dot plots. The first dot plot is labeled “Beats per minute before exercise.” The second dot plot is labeled “Beats per minute after exercise.”

For the dot plot labeled “Beats per minute before exercise,” the numbers 56 through 88, in increments of 4, are indicated on the number line with the following data points.

56 beats per minute, 1 dot.

60 beats per minute, 0 dots.

64 beats per minute, 1 dot.

68 beats per minute, 5 dots.

72 beats per minute, 8 dots.

76 beats per minute, 5 dots.

80 beats per minute, 1 dot.

84 beats per minute, 0 dots.

88 beats per minute, 1 dot.

For the dot plot labeled “Beats per minute after exercise,” the numbers 80 through 112, in increments of 4, are indicated on the number line with the following data points.

80 beats per minute, 2 dots.

84 beats per minute, 2 dots.

88 beats per minute, 3 dots.

92 beats per minute, 3 dots.

96 beats per minute, 2 dots.

100 beats per minute, 3 dots.

104 beats per minute, 3 dots.

108 beats per minute, 2 dots.

112 beats per minute, 2 dots.

End skippable figure description.

Question 28.

Let  and be the standard deviation and range, respectively, of the data before exercise, and let and be the standard deviation and range, respectively, of the data after exercise. Which of the following is true?

29 / 38

29. A photocopy machine is initially loaded with 5,000 sheets of paper. The machine starts a large job and copies at a constant rate. After 20 minutes, it has used 30% of the paper. Which of the following equations models the number of sheets of paper, p, remaining in the machine m minutes after the machine started printing?

30 / 38

30. Question 30 refers to the following figures.

Graph

Table

Begin skippable figure description.

The figure presents the graph of a curve labeled y equals f of x in the x yplane, and a table of values.

On the graph, the numbers 0 through 10, in increments of 2, are indicated on the xaxis. The numbers negative 4 through 4 are indicated on the yaxis. The curve begins at the point with coordinates 2 comma 2, moves upward, and reaches a maximum at the point with coordinates 4 comma 3. It turns and moves downward, passing the xaxis at 6, continues downward, reaches a minimum at the point with coordinates 8 comma negative 3, where it turns, moves upward, and ends at 10 on the xaxis.

The table has 2 columns with 7 rows of data. The heading of the first column is “x.” The heading of the second column is “g of x.” The rows of data are as follows.

Row 1. x, negative 2. g of x, 1.

Row 2. x, negative 1. g of x, 2.

Row 3. x, 0. g of x, 3.

Row 4. x, 1. g of x, 4.

Row 5. x, 2. g of x, 5.

Row 6. x, 3. g of x, 6.

Row 7. x, 4. g of x, 7.

End skippable figure description.

Question 30.

The complete graph of the function f and a table of values for the function g are shown in the preceding figures. The maximum value of f is k. What is the value of   g(k)?

31 / 38

31. Directions

For questions 31 through 38, solve the problem and enter your answer in the grid, as described below, on the answer sheet.

1. Although not required, it is suggested that you write your answer in the boxes at the top of the columns to help you fill in the circles accurately. You will receive credit only if the circles are filled in correctly.

2. Mark no more than one circle in any column.

3. No question has a negative answer.

4. Some problems may have more than one correct answer. In such cases, grid only one answer.

5. Mixed numbers such as must be gridded as 3.5 or 7/2. , is entered into the grid, it will be interpreted as   not

6. Decimal answers: If you obtain a decimal answer with more digits than the grid can accommodate, it may be either rounded or truncated, but it must fill the entire grid.

The following are four examples of how to record your answer in the spaces provided. Keep in mind that there are four spaces provided to record each answer.

Examples 1 and 2

Begin skippable figure description.

Example 1: If your answer is a fraction such as seventwelfths, it should be recorded as follows. Enter 7 in the first space, the fraction bar (a slash) in the second space, 1 in the third space, and 2 in the fourth space. All four spaces would be used in this example.

Example 2: If your answer is a decimal value such as 2.5, it could be recorded as follows. Enter 2 in the second space, the decimal point in the third space, and 5 in the fourth space. Only three spaces would be used in this example.

End skippable figure description.

Example 3


Begin skippable figure description.

Example 3: Acceptable ways to record twothirds are: 2 slash 3, .666, and .667. 

End skippable figure description.

Example 4


Note: You may start your answers in any column, space permitting. Columns you don’t need to use should be left blank.

Begin skippable figure description.

Example 4: It is not necessary to begin recording answers in the first space unless all four spaces are needed. For example, if your answer is 201, you may record 2 in the second space, 0 in the third space, and 1 in the fourth space. Alternatively, you may record 2 in the first space, 0 in the second space, and 1 in the third space. Spaces not needed should be left blank.

End skippable figure description.

Question 31.

There are two atoms of hydrogen and one atom of oxygen in one molecule of water. How many atoms of hydrogen are there in 51 molecules of water?

32 / 38

32. Question 32 refers to the following equation.

Question 32.

If   x = 1 in the preceding equation, what is the value of a?

33 / 38

33. In the xyplane, the equations   x + 2 y = 10 and   3 x + 6 y = c represent the same line for some constant c. What is the value of ?

34 / 38

34. On April 18, 1775, Paul Revere set off on his midnight ride from Charlestown to Lexington. If he had ridden straight to Lexington without stopping, he would have traveled 11 miles in 26 minutes. In such a ride, what would the average speed of his horse have been, to the nearest tenth of a mile per hour?

35 / 38

35. Question 35 refers to the following figure.

Begin skippable figure description.

The figure presents the graph of a curve in the x yplane. The curve is labeled y equals f of x. The numbers 0 through 9 are indicated on the xaxis. The numbers 0 through 12, in increments of 2, are indicated on the yaxis. The curve begins at the point with coordinates 0 comma 2 and moves upward and to the right reaching a maximum at the point with coordinates 4 comma 10. It turns and moves downward and to the right, ending at 8.5 on the xaxis.

End skippable figure description.

Question 35.

The graph of the function defined by , is shown in the preceding xyplane. If the function g (not shown) is defined by   g(x) = –x + 10, what is one possible value of a such that   f(a) = g(a)?

36 / 38

36. Question 36 refers to the following figure.

Begin skippable figure description.

The figure presents right triangle R S T such that side R T is horizontal, vertex T is to the right of vertex R, and vertex S is above R T. Side R S is labeled 12. Side S T is labeled 5. Angle S is a right angle.

End skippable figure description.

Question 36.

In preceding triangle RST, point W (not shown) lies on   . What is the value of  ?

37 / 38

37. Questions 37 and 38 refer to the following information.

When a patient receives a penicillin injection, the kidneys begin removing the penicillin from the body. The following table and graph show the penicillin concentration in a patient’s bloodstream at 5minute intervals for the 20 minutes immediately following a onetime penicillin injection.

Table

Graph

Begin skippable figure description.

The figure presents a table and a graph of a curve in the coordinate plane.

The table has 2 columns with 5 rows of data. The heading for column 1 is “Minutes after injection.” The heading for column 2 is “Penicillin concentration, in micrograms per milliliter.” The data for the 5 rows are as follows.

Row 1. Minutes after injection, 0. Penicillin concentration in micrograms per milliliter, 200.

Row 2. Minutes after injection, 5. Penicillin concentration in micrograms per milliliter, 152.

Row 3. Minutes after injection, 10. Penicillin concentration in micrograms per milliliter, 118.

Row 4. Minutes after injection, 15. Penicillin concentration in micrograms per milliliter, 93.

Row 5. Minutes after injection, 20. Penicillin concentration in micrograms per milliliter, 74.

On the graph, the horizontal axis is labeled “Time, in minutes,” and the numbers 0 through 20, in increments of 5, are indicated. The vertical axis is labeled “Penicillin concentration, in micrograms per milliliter,” and the numbers 0 through 200, in increments of 50, are indicated. There are 5 data points and they are connected by a curve. The data points are situated at points with coordinates equal to 0 comma 200; 5 comma 152; 10 comma 118; 15 comma 93; and 20 comma 74.

End skippable figure description.

Question 37.

According to the table, how many more micrograms of penicillin are present in 10 milliliters of blood drawn from the patient 5 minutes after the injection than are present in 8 milliliters of blood drawn 10 minutes after the injection?

38 / 38

38. The penicillin concentration, in micrograms per milliliter, in the patient’s bloodstream t minutes after the penicillin injection is modeled by the function P defined by . If P approximates the values in the table to within 10 micrograms per milliliter, what is the value of b, rounded to the nearest tenth?

Shopping cart0
There are no products in the cart!
Continue shopping
0