12. Questions 12 through 22 are based on the following passage and supplementary material.
Dark Snow
Most of Greenland’s interior is covered by a thick layer of ice and compressed snow known as the Greenland Ice Sheet. The size of the ice sheet fluctuates seasonally: in summer, average daily high temperatures in Greenland can rise to slightly above 50 degrees Fahrenheit, partially melting the ice; in the winter, the sheet thickens as additional snow falls, and average daily low temperatures can drop [Q12] to as low as 20 degrees.
Typically, the ice sheet begins to show evidence of thawing in late [Q13] summer. This follows several weeks of higher temperatures. [Q14] For example, in the summer of 2012, virtually the entire Greenland Ice Sheet underwent thawing at or near its surface by mid-July, the earliest date on record. Most scientists looking for the causes of the Great Melt of 2012 have focused exclusively on rising temperatures. The summer of 2012 was the warmest in 170 years, records show. But Jason [Q15] Box, an associate professor of geology at Ohio State believes that another factor added to the early [Q16] thaw; the “dark snow” problem.
According to Box, a leading Greenland expert, tundra fires in 2012 from as far away as North America produced great amounts of soot, some [Q17] of it drifted over Greenland in giant plumes of smoke and then [Q18] fell as particles onto the ice sheet. Scientists have long known that soot particles facilitate melting by darkening snow and ice, limiting [Q19] it’s ability to reflect the Sun’s rays. As Box explains, “Soot is an extremely powerful light absorber. It settles over the ice and captures the Sun’s heat.” The result is a self-reinforcing cycle. As the ice melts, the land and water under the ice become exposed, and since land and water are darker than snow, the surface absorbs even more heat, which [Q20] is related to the rising temperatures.
Box’s research is important because the fires of 2012 may not be a one-time phenomenon. According to scientists, rising Arctic temperatures are making northern latitudes greener and thus more fire prone. The pattern Box observed in 2012 may repeat [Q21] itself again, with harmful effects on the Arctic ecosystem. Box is currently organizing an expedition to gather this crucial information. The next step for Box and his team is to travel to Greenland to perform direct sampling of the ice in order to determine just how much the soot is contributing to the melting of the ice sheet. Members of the public will be able to track his team’s progress—and even help fund the expedition—through a website Box has created. [Q22]
Adapted from W M O. Copyright 2014 by World Meteorological Organization.
Begin skippable figure description.
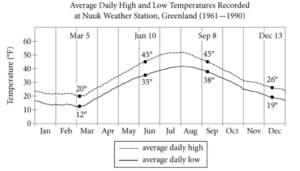
The figure presents a graph of two curves titled “Average Daily High and Low Temperatures Recorded at Nuuk Weather Station, Greenland, 1961 through 1990.” The vertical axis is labeled “Temperature,” in degrees Fahrenheit, and numbers 0 to 60 in increments of 10, appear along the vertical axis. The 12 months, January to December, appear along the horizontal axis, and there are 12 vertical gridlines, together with the vertical axis, dividing the horizontal axis into 12 intervals of equal length, each denoting the period of a month. In the figure, two curves appear one above another, and as indicated in the key the top curve is a dashed line and represents the average daily high temperature. The bottom curve is a solid line and represents the average daily low temperature. According to the graph, both curves move downward and upward from January through December in a similar pattern.
The top curve, representing the average daily high temperature, starts on the vertical axis at about 23 degrees, moves downward gently, crossing January, February, and March, and reaches a low point labeled 20 degrees for March 5. Then it goes up more steeply, passing the point labeled 45 degrees for June 10, and continues to go up until it reaches a peak point of about 50 degrees at the end of July. The curve starts going downward, moving through August and passing the point labeled 45 degrees for September 8, and continues to move downward, crossing October, November, and December. It passes through the point labeled 26 degrees for December 13 and continues to go down, ending on the right most vertical gridline at about 23 degrees at the end of December.
Similarly, the bottom curve, representing the average daily low temperature, starts on the vertical axis at about 17 degrees, moves downward gently, crossing January, February, and March, and reaches a low point labeled 12 degrees for March 5. Then it goes up more steeply, passing the point labeled 35 degrees for June 10, and continues to go up until it reaches a peak point of about 41 degrees at the end of July. The curve starts going downward, moving through August and passing the point labeled 38 degrees for September 8, and continues to move downward, crossing October, November, and December. It passes through the point labeled 19 degrees for December 13 and continues to go down, ending on the right most vertical gridline at about 17 degrees at the end of December.
End skippable figure description.
Question 12.
Which choice most accurately and effectively represents the information in the graph?
Answer choices in context.
Begin skippable content.
A. The size of the ice sheet fluctuates seasonally: in summer, average daily high temperatures in Greenland can rise to slightly above 50 degrees Fahrenheit, partially melting the ice; in the winter, the sheet thickens as additional snow falls, and average daily low temperatures can drop to as low as 20 degrees.
B. The size of the ice sheet fluctuates seasonally: in summer, average daily high temperatures in Greenland can rise to slightly above 50 degrees Fahrenheit, partially melting the ice; in the winter, the sheet thickens as additional snow falls, and average daily low temperatures can drop to 12 degrees Fahrenheit.
C. The size of the ice sheet fluctuates seasonally: in summer, average daily high temperatures in Greenland can rise to slightly above 50 degrees Fahrenheit, partially melting the ice; in the winter, the sheet thickens as additional snow falls, and average daily low temperatures can drop to their lowest point on December 13.
D. The size of the ice sheet fluctuates seasonally: in summer, average daily high temperatures in Greenland can rise to slightly above 50 degrees Fahrenheit, partially melting the ice; in the winter, the sheet thickens as additional snow falls, and average daily low temperatures can drop to 10 degrees Fahrenheit and stay there for months.