23. Questions 23 through 33 are based on the following passage and supplementary material.
Rethinking Crowdfunding in the Arts
Crowdfunding is a popular way to raise money using the Internet. The process sounds simple: an artist, entrepreneur, or other innovator takes his or her ideas straight to the public via a crowdfunding website. The innovator creates a video about the project and offers, in exchange for donations, a series of “perks,” from acknowledgment on a social media site to a small piece of art. Many crowdfunding programs are allornothing; in other words, the innovator must garner 100 percent funding for the project or the money is refunded to the donors. At [Q23] it’s best, the system can give creators direct access to millions of potential backers.
The home page of one leading crowdfunding site features a project to manufacture pinhole cameras on a 3D printer. [Q24] The idea is obviously very attractive. An obscure method of photography may be made available to many with little expense. Within weeks, the project was 621 percent funded. In contrast, on the same page, a small Brooklyn performance venue is attempting to raise money for its current season. The venue features works of performance art showcased in a storefront window. Those who have seen the space consider it vital. [Q25] However, that group may not be large enough; with just fourteen days to go in the fundraising period, the campaign is only 46 percent funded.
Artists such as these Brooklyn performers find that crowdfunding exacerbates problems that already exist. [Q26] Work, that is easily understood and appreciated, is supported, while more complex work goes unnoticed. [Q27] Time that could be used creating art is spent devising clever perks to draw the attention of potential contributors. [Q28] In addition, audiences may contain many “free [Q29] riders,” they did not make contributions. Ironically, the success of crowdfunding may weaken overall funding for the arts if people begin to feel that paying for the art [Q30] loved by them is someone else’s responsibility.
One innovative playwright has woven the deficiencies of the system into her crowdfunding model. Though the price for her tickets was higher than that of tickets for comparable shows, it was still affordable to most theatergoers—and reflected the real cost of the performance. She presented the total cost for producing her play on a crowdfunding site. Then she divided the total cost by the number of people she expected to attend the performance. The result of the calculation was the minimum donor price, and only donors who paid at least the minimum ticket price were allowed to attend the performance. By subverting the presumption that money used for her project is an altruistic donation, the playwright showed that [Q31] our work has monetary value to those who enjoy it. [Q32]
Note: The following figures supplement this passage.
Adapted from “These Were the Most Successful Projects on Kickstarter Last Year.” ©2013 by The Economist Newspaper Limited.
Question 33 asks about the graphs.
Begin skippable figure description.
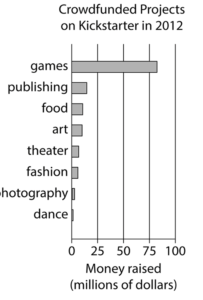
The figure presents three horizontal bar graphs titled “Crowdfunded Projects on Kickstarter in 2012.” For the first bar graph, the horizontal axis is labeled “Money raised, in millions of dollars,” and the numbers 0 through 100, in increments of 25, are indicated. There are 8 bars representing different project categories. From top to bottom, the data represented by each of the bars are as follows. Note that all values are approximate.
Games, $82 million
Publishing, $15 million
Food, $13 million
Art, $12 million
Theater, $8 million
Fashion, $7 million
Photography, $3 million
Dance, $2 million
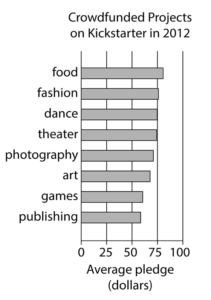
For the second bar graph, the horizontal axis is labeled “Average pledge, in dollars,” and the numbers 0 through 100, in increments of 25, are indicated. There are 8 bars representing different project categories. From top to bottom, the data represented by each of the bars are as follows. Note that all values are approximate.
Food, $80
Fashion, $77
Dance, $75
Theater, $74
Photography, $71
Art, $68
Games, $62
Publishing, $59
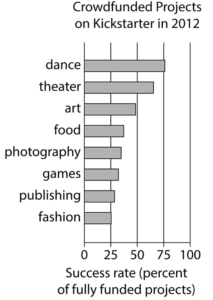
For the third bar graph, the horizontal axis is labeled “Success rate, in percent of fully funded projects,” and the numbers 0 through 100, in increments of 25, are indicated. There are 8 bars representing different project categories. From top to bottom, the data represented by each of the bars are as follows. Note that all values are approximate.
Dance, 77%
Theater, 68%
Art, 48%
Food, 36%
Photography, 33%
Games, 30%
Publishing, 27%
Fashion, 25%
End skippable figure description.
Question 23.
Answer choices in context:
Begin skippable content.
A. At it’s best, the system can give creators direct access to millions of potential backers.
B. At its best, the system can give creators direct access to millions of potential backers.
C. At its’ best, the system can give creators direct access to millions of potential backers.
D. At their best, the system can give creators direct access to millions of potential backers.
End skippable content.