1. Turn to Section 4 of your answer sheet to answer the questions in this section.
Directions
For questions 1 through 30, solve each problem, choose the best answer from the choices provided, and fill in the corresponding circle on your answer sheet. For questions 31 through 38, solve the problem and enter your answer in the grid on the answer sheet. Please refer to the directions before question 31 on how to enter your answers in the grid. You may use scratch paper for scratch work.
Notes
1. The use of a calculator is permitted.
2. All variables and expressions used represent real numbers unless otherwise indicated.
3. Figures provided in this test are drawn to scale unless otherwise indicated.
4. All figures lie in a plane unless otherwise indicated.
5. Unless otherwise indicated, the domain of a given function f is the set of all real numbers x for which f (x) is a real number.
Reference
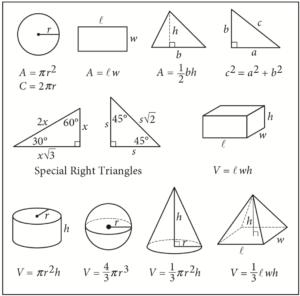
Begin skippable figure descriptions.
The figure presents information for your reference in solving some of the problems.
Reference figure 1 is a circle with radius r. Two equations are presented below reference figure 1.
A equals pi times the square of r.
C equals 2 pi r.
Reference figure 2 is a rectangle with length ℓ and width w. An equation is presented below reference figure 2.
A equals ℓ w.
Reference figure 3 is a triangle with base b and height h. An equation is presented below reference figure 3.
A equals onehalf b h.
Reference figure 4 is a right triangle. The two sides that form the right angle are labeled a and b, and the side opposite the right angle is labeled c. An equation is presented below reference figure 4.
c squared equals a squared plus b squared.
Special Right Triangles
Reference figure 5 is a right triangle with a 30degree angle and a 60degree angle. The side opposite the 30degree angle is labeled x. The side opposite the 60degree angle is labeled x times the square root of 3. The side opposite the right angle is labeled 2 x.
Reference figure 6 is a right triangle with two 45degree angles. Two sides are each labeled s. The side opposite the right angle is labeled s times the square root of 2.
Reference figure 7 is a rectangular solid whose base has length ℓ and width w and whose height is h. An equation is presented below reference figure 7.
V equals ℓ w h.
Reference figure 8 is a right circular cylinder whose base has radius r and whose height is h. An equation is presented below reference figure 8.
V equals pi times the square of r times h.
Reference figure 9 is a sphere with radius r. An equation is presented below reference figure 9.
V equals fourthirds pi times the cube of r.
Reference figure 10 is a cone whose base has radius r and whose height is h. An equation is presented below reference figure 10.
V equals onethird times pi times the square of r times h.
Reference figure 11 is an asymmetrical pyramid whose base has length ℓ and width w and whose height is h. An equation is presented below reference figure 11.
V equals onethird ℓ w h.
End skippable figure descriptions.
Additional Reference Information
The number of degrees of arc in a circle is 360.
The number of radians of arc in a circle is 2 pi.
The sum of the measures in degrees of the angles of a triangle is 180.
Question 1 refers to the following figure.
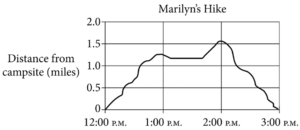
Begin skippable figure description.
The figure presents a graph titled “Marilyn’s Hike” in a coordinate plane. The horizontal axis has 4 equally spaced tick marks labeled, from left to right, 12 P.M., 1 P.M., 2 P.M., and 3 P.M., and there are vertical gridlines at those tick marks. The vertical axis is labeled “Distance from campsite, in miles,” and the numbers 0, to 2.0, in increments of 0.5, appear along the vertical axis. There are horizontal gridlines at those numbers. In the figure, a curve starts off at 12 P.M. at 0 mile, moves upward and to the right while it fluctuates, passing 1 P.M. at a distance of 1.25 miles, until it stops fluctuating at a time that is one sixth of the hour past 1 P.M. Then it moves horizontally until a time that is two thirds of the hour past 1 P.M. The curve starts moving upward and to the right, until it crosses 2 P.M. at about 1.6 miles. The curve then fluctuates down and to the right until it stops at 3 P.M. at 0 mile.
End skippable figure description.
Question 1.
The preceding graph shows Marilyn’s distance from her campsite during a 3hour hike. She stopped for 30 minutes during her hike to have lunch. Based on the graph, which of the following is closest to the time she finished lunch and continued her hike?