21. Questions 21 through 31 are based on the following passage and supplementary material.
This passage is adapted from Marlene Zuk, Paleofantasy: What Evolution Really Tells Us about Sex, Diet, and How We Live. ©2013 by Marlene Zuk.
A female guppy can be sexually mature at two months of age and have her first babies just a month later. This unstinting rate of reproduction makes guppies ideally suited for studying the rate of evolution, and David Reznick, a biologist at U C Riverside, has been doing exactly that for the last few decades.
People usually think of guppies as colorful aquarium fish, but they also have a life in the real world, inhabiting streams and rivers in tropical places like Trinidad, where Reznick has done his fieldwork. Guppies can experience different kinds of conditions depending on the luck of the draw. A lucky guppy is born above a waterfall or a set of rapids, which keep out the predatory fish called pike cichlids found in calmer downstream waters. As you might expect, the guppy mortality rate—that is, the proportion of individuals that die—is much higher in the sites with the rapacious cichlids than in those without them.
Reznick has shown that if you bring the fish into the lab and let them breed there, the guppies from the sites with many predators become sexually mature when they are younger and smaller than do the guppies from the predatorfree sites. In addition, the litters of baby guppies produced by mothers from the highrisk streams are larger, but each individual baby is smaller than those produced by their counterparts. The disparity makes sense because if you are at risk of being eaten, being able to have babies sooner, and spreading your energy reserves over a lot of them, makes it more likely that you will manage to pass on some of your genes before you meet your fate. Reznick and other scientists also demonstrated that these traits are controlled by the guppies’ genes, not by the environment in which they grow up.
How quickly, though, could these differences in how the two kinds of guppies lived their lives have evolved? Because there are numerous tributaries of the streams in Trinidad, with guppies living in some but not all of them, Reznick realized that he could, as he put it in a 2008 paper, “treat streams like giant test tubes by introducing guppies or predators” to places they had not originally occurred, and then watch as natural selection acted on the guppies. This kind of realworld manipulation of nature is called “experimental evolution,” and it is growing increasingly popular among scientists working with organisms that reproduce quickly enough for humans to be able to see the outcome within our lifetimes.
Along with his students and colleagues, Reznick removed groups of guppies from their predatorridden lives below the waterfall and released them into previously guppyfree streams above the falls. Although small predatory killifish occurred in these new sites, these fish do not pose anything close to the danger of the cichlids. Then the scientists waited for nature to do its work, and they brought the descendants of the transplanted fish back to the lab to examine their reproduction. After just eleven years, the guppies released in the new streams had evolved to mature later, and have fewer, bigger offspring in each litter, just like the guppies that naturally occurred in the cichlidfree streams. Other studies of guppies in Trinidad have shown evolutionary change in as few as two and a half years, or a little over four generations, with more time required for genetic shifts in traits such as the ability to form schools and less time for changes in the colorful spots and stripes on a male’s body.
Note: The following two figures supplement this passage.
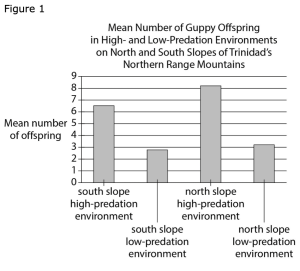
Figure 1
Begin skippable figure description.
Figure 1 presents a bar graph titled “Mean Number of Guppy Offspring in High and LowPredation Environments on North and South Slopes of Trinidad’s Northern Range Mountains.” The following four categories are indicated on the horizontal axis, from left to right: “south slope highpredation environment,” “south slope lowpredation environment,” “north slope highpredation environment,” and “north slope lowpredation environment.” The vertical axis is labeled “Mean number of offspring,” and the numbers 0 through 9, in increments of 1, are indicated. The data represented by the bars are as follows. Note that all values are approximate.
South slope highpredation environment, 6.5.
South slope lowpredation environment, 2.9.
North slope highpredation environment, 8.1.
North slope lowpredation environment, 3.1.
End skippable figure description.
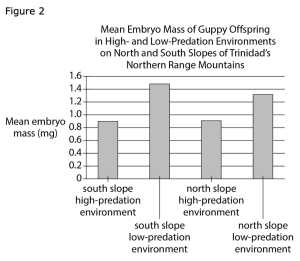
Figure 2
Begin skippable figure description.
The figure presents a bar graph titled “Mean Embryo Mass of Guppy Offspring in High and LowPredation Environments on North and South Slopes of Trinidad’s Northern Range Mountains.” The following four categories are indicated on the horizontal axis, from left to right: “south slope highpredation environment,” “south slope lowpredation environment,” “north slope highpredation environment,” and “north slope lowpredation environment.” The vertical axis is labeled “Mean embryo mass, in milligrams,” and the numbers 0 through 1.6, in increments of 0.2, are indicated. The data represented by the bars are as follows. Note that all values are approximate.
South slope highpredation environment, 0.9.
South slope lowpredation environment, 1.5.
North slope highpredation environment, 0.9.
North slope lowpredation environment, 1.3.
End skippable figure description.
Figures adapted from David N. Reznick, Cameron K. Ghalambor, and Kevin Crooks, “Experimental Studies of Evolution in Guppies: A Model for Understanding the Evolutionary Consequences of Predator Removal in Natural Communities.” ©2007 by Blackwell Publishing Limited.
Question 21.
Paragraph 1 mainly serves to