MATHEMATICS TEST—CALCULATOR 4

There is no penalty for wrong answers, so it makes sense to give the best answer you can to every question, even if it is just your best guess.

The time is up. You have completed all sections of the SAT.


Math – Calculator Tests

Mathematics Test—Calculator 4

38 Questions. 55 Minutes to Complete. 

Directions

Notes

1. The use of a calculator is permitted.

2. All variables and expressions used represent real numbers unless otherwise indicated.

3. Figures provided in this test are drawn to scale unless otherwise indicated.

4. All figures lie in a plane unless otherwise indicated.

5. Unless otherwise indicated, the domain of a given function f is the set of all real numbers x for which  f (x) is a real number.


For questions 1 through 30, solve each problem, choose the best answer from the choices provided, and fill in the corresponding circle on your answer sheet. For questions 31 through 38, solve the problem and enter your answer in the grid on the answer sheet.

1 / 38

1. Directions

For questions 1 through 30, solve each problem, choose the best answer from the choices provided, and fill in the corresponding circle on your answer sheet. For questions 31 through 38, solve the problem and enter your answer in the grid on the answer sheet. Please refer to the directions before question 31 on how to enter your answers in the grid. You may use scratch paper for scratch work.

Notes

1. The use of a calculator is permitted.

2. All variables and expressions used represent real numbers unless otherwise indicated.

3. Figures provided in this test are drawn to scale unless otherwise indicated.

4. All figures lie in a plane unless otherwise indicated.

5. Unless otherwise indicated, the domain of a given function f is the set of all real numbers x for which f (x) is a real number.

Reference
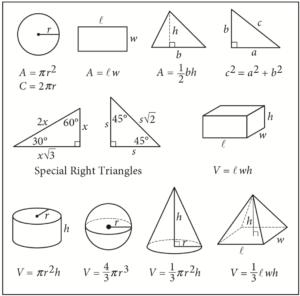
Begin skippable figure descriptions.

The figure presents information for your reference in solving some of the problems.

Reference figure 1 is a circle with radius r. Two equations are presented below reference figure 1.

A equals pi times the square of r.

C equals 2 pi r.

Reference figure 2 is a rectangle with length  and width w. An equation is presented below reference figure 2.

A equals  w.

Reference figure 3 is a triangle with base b and heighh. An equation is presented below reference figure 3.

A equals onehalf b h.

Reference figure 4 is a right triangle. The two sides that form the right angle are labeled a and b, and the side opposite the right angle is labeled c. An equation is presented below reference figure 4.

c squared equals a squared plus b squared.

Special Right Triangles

Reference figure 5 is a right triangle with a 30degree angle and a 60degree angle. The side opposite the 30degree angle is labeled x. The side opposite the 60degree angle is labeled x times the square root of 3. The side opposite the right angle is labeled 2 x.

Reference figure 6 is a right triangle with two 45degree angles. Two sides are each labeled s. The side opposite the right angle is labeled s times the square root of 2.

Reference figure 7 is a rectangular solid whose base has length  and width w and whose height is h. An equation is presented below reference figure 7.

V equals  w h.

Reference figure 8 is a right circular cylinder whose base has radius r and whose height is h. An equation is presented below reference figure 8.

V equals pi times the square of r times h.

Reference figure 9 is a sphere with radius r. An equation is presented below reference figure 9.

V equals fourthirds pi times the cube of r.

Reference figure 10 is a cone whose base has radius r and whose height is h. An equation is presented below reference figure 10.

V equals onethird times pi times the square of r times h.

Reference figure 11 is an asymmetrical pyramid whose base has length  and width w and whose height is h. An equation is presented below reference figure 11.

V equals onethird  w h.

End skippable figure descriptions.

Additional Reference Information

The number of degrees of arc in a circle is 360.

The number of radians of arc in a circle is 2 pi.

The sum of the measures in degrees of the angles of a triangle is 180.

Question 1 refers to the following graph.
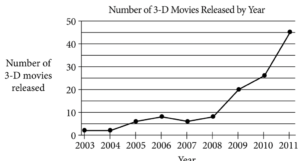
Begin skippable figure description.

The figure presents a line graph titled “Number of 3D Movies Released by Year.” The horizontal axis is labeled “Year,” and the years 2003 through 2011 are indicated. The vertical axis is labeled “Number of 3D movies released,” and the numbers 0 through 50, in increments of 10, are indicated. The data, represented by 9 points on the graph, are as follows. Note that all values are approximate.

2003, 2 movies.

2004, 2 movies.

2005, 6 movies.

2006, 8 movies.

2007, 6 movies.

2008, 8 movies.

2009, 20 movies.

2010, 26 movies.

2011, 46 movies.

End skippable figure description.

Question 1.

Which expression is equivalent to ?

2 / 38

2. Question 2 refers to the following figure.

Begin skippable figure description.

The figure presents a graph of 2 lines in the first quadrant in the x yplane with origin labeled O. The xaxis is labeled “Time, in seconds,” and the numbers 5 and 10 are indicated. The yaxis is labeled “Distance, in yards,” and the numbers 12 through 60, in increments of 12, are indicated. One line is labeled “Paul,” and the other line is labeled “Mark.” The behavior of the 2 lines in the graph is as follows.

The line labeled “Paul” begins at the origin and moves upward and to the right until reaching a point with coordinates 6 comma 60.

The line labeled “Mark” begins on the yaxis at 18 and moves upward and to the right until reaching a point with the coordinates 10 comma 60.

The lines intersect at approximately the point with coordinates 3 comma 30.

End skippable figure description.

Question 2.

The preceding graph shows the positions of Paul and Mark during a race. Paul and Mark each ran at a constant rate, and Mark was given a head start to shorten the distance he needed to run. Paul finished the race in 6 seconds, and Mark finished the race in 10 seconds. According to the graph, Mark was given a head start of how many yards?

3 / 38

3. Snow fell and then stopped for a time. When the snow began to fall again, it fell at a faster rate than it had initially. Assuming that none of the snow melted during the time indicated, which of the following graphs could model the total accumulation of snow versus time?

Each option presents a graph in the first quadrant of a coordinate plane. The horizontal axis is labeled “Time,” and the vertical axis is labeled “Accumulation.” There are no scales on either axis.

4 / 38

4. A websitehosting service charges businesses a onetime setup fee of $350 plus d dollars for each month. If a business owner paid $1,010 for the first 12 months, including the setup fee, what is the value of d?

5 / 38

5. Question 5 refers to the following inequality.

  6 x – 9 y > 12

Question 5.

Which of the following inequalities is equivalent to the preceding inequality?

6 / 38

6. Question 6 refers to the following table.

Where Do People Get Most of Their Medical Information?

Source

Percent of those surveyed

Doctor

63%

Internet

13%

Magazines or brochures

9%

Pharmacy

6%

Television

2%

Other or none of the above

7%

Question 6.

The preceding table shows a summary of 1,200 responses to a survey question. Based on the table, how many of those surveyed get most of their medical information from either a doctor or the Internet?

7 / 38

7. The members of a city council wanted to assess the opinions of all city residents about converting an open field into a dog park. The council surveyed a sample of 500 city residents who own dogs. The survey showed that the majority of those sampled were in favor of the dog park. Which of the following is true about the city council’s survey?

8 / 38

8. Question 8 refers to the following table.

Begin skippable figure description.

The figure presents a 4column table, with 2 rows of data, titled “Ice Cream and Topping Selections.” There are no headings for columns 1 and 2. The heading for columns 3 and 4 is “Flavor.” The subheading for column 3 is “Vanilla,” and the subheading for column 4 is “Chocolate.” The heading for rows 1 and 2, which is located in column 1, is “Topping.” The subheading for row 1 is “Hot fudge,” and the subheading for row 2 is “Caramel.” The 2 rows of data are as follows.

Row 1, hot fudge and vanilla, 8; hot fudge and chocolate, 6.

Row 2, caramel and vanilla, 5; caramel and chocolate, 6.

End skippable figure description.

Question 8.

The preceding table shows the flavors of ice cream and the toppings chosen by the people at a party. Each person chose one flavor of ice cream and one topping. Of the people who chose vanilla ice cream, what fraction chose hot fudge as a topping?

9 / 38

9. The total area of a coastal city is 92.1 square miles, of which 11.3 square miles is water. If the city had a population of 621,000 people in the year 2010, which of the following is closest to the population density, in people per square mile of land area, of the city at that time?

10 / 38

10. Between 1497 and 1500, Amerigo Vespucci embarked on two voyages to the New World. According to Vespucci’s letters, the first voyage lasted 43 days longer than the second voyage, and the two voyages combined lasted a total of 1,003 days. How many days did the second voyage last?

11 / 38

11. Question 11 refers to the following system of equations.


7 x + 3 y = 8

6 x – 3 y = 5

Question 11.

For the solution  (x, y) to the preceding system of equations, what is the value o x – y?

12 / 38

12. Questions 12 through 14 refer to the following information.

In 1919, H. S. Reed and R. H. Holland published a paper on the growth of sunflowers. Included in the paper were the following table and graph, which show the height h, in centimeters, of a sunflower t days after the sunflower begins to grow.

Sunflower Growth

Day

Height (centimeters)

0

0.00

7

17.93

14

36.36

21

67.76

28

98.10

35

131.00

42

169.50

49

205.50

56

228.30

63

247.10

70

250.50

77

253.80

84

254.50

Begin skippable figure description.

The figure, which presents a line graph in the first quadrant of a t hcoordinate plane, is titled “Sunflower Height over Time.” The horizontal taxis is labeled “Time, in days,” and the numbers 0 through 84, in increments of 7, are indicated. The vertical haxis is labeled “Height, in centimeters,” and the numbers 0 through 260, in increments of 20, are indicated. There are 13 points on the graph that represent the data given in the preceding table. The curve is made up of 12 line segments connecting each of the data points from the table, beginning at the point with coordinates 0 comma 0, moving upward and to the right, and ending at the point with coordinates 84 comma 254.50.

End skippable figure description.

Question 12.

Based on the given information, over which of the following time periods is the average growth rate of the sunflower least?

13 / 38

13. In respect to the given information, the function h, defined by   h(t) = atb, where a and b are constants, models the height, in centimeters, of the sunflower after t days of growth during a time period in which the growth is approximately linear. What does a represent?

14 / 38

14. Based on the given information, the growth rate of the sunflower from day 14 to day 35 is nearly constant. On this interval, which of the following equations best models the height h, in centimeters, of the sunflower t days after it begins to grow?

15 / 38

15. Question 15 refers to the following figure.


Begin skippable figure description.

The figure presents a 2row table with 5 columns of data. The heading for the first row is “x.” The heading for the second row is “y.” The 5 columns of data are as follows.

Column 1: x, 1; y, the fraction 11 over 4.

Column 2: x, 2; y, the fraction 25 over 4.

Column 3: x, 3; y, the fraction 39 over 4.

Column 4: x, 4; y, the fraction 53 over 4.

Column 5: x, 5; y, the fraction 67 over 4.

End skippable figure description.

Question 15.

Which of the following equations relates y to x for the values in the preceding table?

16 / 38

16. Question 16 refers to the following figure.


Begin skippable figure description.

The figure presents two right triangles, ABC and DEF. In triangle ABC, side AC is horizontal, and side BC is drawn such that it is perpendicular to side AC and point B is above point C. Angle A is labeled 32 degrees, and the right angle symbol is indicated at angle C. In triangle DEF, side DF is horizontal, side EF is drawn such that it is perpendicular to side DF, and point E is above point F. Angle D is labeled 58 degrees, and the right angle symbol is indicated at angle F.

End skippable figure description.

Question 16.

Triangles A B C and D E F are shown in the preceding figure. Which of the following is equal to the ratio ?

17 / 38

17. Questions 17 through 19 refer to the following information.

When designing a stairway, an architect can use the risertread formula   2 h + d = 25, where h is the riser height, in inches, and d is the tread depth, in inches. For any given stairway, the riser heights are the same and the tread depths are the same for all steps in that stairway.

The number of steps in a stairway is the number of its risers. For example, there are 5 steps in the stairway in the following figure. The total rise of a stairway is the sum of the riser heights as shown in the figure.

Begin skippable figure description.

The figure presents a drawing of the side view of a stairway that has 5 steps. The height of the stairway is labeled “total rise.” The height of each step is labeled “riser height, h,” and the width of each step is labeled “tread depth, d.” Note: the figure is not drawn to scale.

End skippable figure description.

Question 17.

Based on the given information, which of the following expresses the riser height in terms of the tread depth?

18 / 38

18. Some building codes require that, for indoor stairways, the tread depth must be at least 9 inches and the riser height must be at least 5 inches. According to the risertread formula (refer to the given information), which of the following inequalities represents the set of all possible values for the riser height that meets this code requirement?

19 / 38

19. An architect wants to use the risertread formula (refer to the given information) to design a stairway with a total rise of 9 feet, a riser height between 7 and 8 inches, and an odd number of steps. With the architect’s constraints, which of the following must be the tread depth, in inches, of the stairway? (1 foot equals 12 inches.)

20 / 38

20. What is the sum of the solutions to  (x – 6)(x + 0.7) = 0?

21 / 38

21. A study was done on the weights of different types of fish in a pond. A random sample of fish were caught and marked in order to ensure that none were weighed more than once. The sample contained 150 largemouth bass, of which 30% weighed more than 2 pounds. Which of the following conclusions is best supported by the sample data?

22 / 38

22. Question 22 refers to the following table.

Number of States with 10 or More Electoral Votes in 2008

Electoral votes

Frequency

10

4

11

4

12

1

13

1

15

3

17

1

20

1

21

2

27

1

31

1

34

1

55

1

Question 22.

In 2008, there were 21 states with 10 or more electoral votes, as shown in the preceding table. Based on the table, what was the median number of electoral votes for the 21 states?

23 / 38

23. Question 23 refers to the following figure.


Begin skippable figure description.

The figure presents a graph titled “Height versus Time for a Bouncing Ball.” The horizontal axis is labeled “Time elapsed, in seconds,” and the numbers 0 through 3 are indicated. The vertical axis is labeled “Height, in feet,” and the numbers 0 through 4 are indicated. The graph begins on the vertical axis at 4 feet and curves steeply downward and to the right until it reaches the horizontal axis at 0.5 seconds. It then curves upward and to the right until reaching approximately 2.4 feet at approximately 0.9 seconds and then curves back downward and to the right until it reaches the horizontal axis at approximately 1.3 seconds. The graph then curves upward and to the right until reaching approximately 1.25 feet at approximately 1.6 seconds and then curves back downward and to the right until it reaches the horizontal axis at approximately 1.9 seconds. This pattern is repeated five more times with the height reached by the curve decreasing each time the pattern is repeated.

End skippable figure description.

Question 23.

As part of an experiment, a ball was dropped and allowed to bounce repeatedly off the ground until it came to rest. The preceding graph represents the relationship between the time elapsed after the ball was dropped and the height of the ball above the ground. After it was dropped, how many times was the ball at a height of 2 feet?

24 / 38

24. A customer’s monthly water bill was $75.74. Due to a rate increase, her monthly bill is now $79.86. To the nearest tenth of a percent, by what percent did the amount of the customer’s water bill increase?

25 / 38

25. Question 25 refers to the following figure.

Begin skippable figure description.

The figure presents a 2column table with 3 rows of data. The heading for the first column is “x,” and the heading for the second column is “f of x.” The 3 rows of data are as follows.

Row 1: x, 0; f of x, negative 2.

Row 2: x, 2; f of x, 4.

Row 3: x, 6; f of x, 16.

End skippable figure description.

Question 25.

Some values of the linear function f are shown in the preceding table. What is the value of   f(3)?

26 / 38

26. Question 26 refers to the following information.

A gear ratio r:s (r to s) is the ratio of the number of teeth of two connected gears. The ratio of the number of revolutions per minute of two gear wheels is s:r (s to r). In the following diagram, Gear, A, is turned by a motor. The turning of Gear, A, causes Gears B and C to turn as well.

Begin skippable figure description.

The figure presents a diagram of 3 gears of three different radii arranged side by side such that Gear, A, is interlocked with Gear B and Gear B is interlocked with Gear C. The gears are labeled, from left to right, as follows. “Gear, A, 20 teeth,” “Gear B, 60 teeth,” and “Gear C, 10 teeth.”

End skippable figure description.

Question 26.

If Gear, A, is rotated by the motor at a rate of 100 revolutions per minute, what is the number of revolutions per minute for Gear C?

27 / 38

27. In the xyplane, the graph o   is a circle. What is the radius of the circle?

28 / 38

28. Two different points on a number line are both 3 units from the point with coordinate  -4. The solution to which of the following equations gives the coordinates of both points?

29 / 38

29. A motor powers a model car so that after starting from rest, the car travels s inches in t seconds, where  . Which of the following gives the average speed of the car, in inches per second, over the first t seconds after it starts?

30 / 38

30. Question 30 refers to the following information.

The following scatterplot shows the amount of electric energy generated, in millions of megawatthours, by nuclear sources over a 10year period.

Begin skippable figure description.

The figure presents a scatterplot in the x yplane titled “Electric Energy Generated by Nuclear Sources.” The xaxis is labeled “Time, in years,” and the numbers 0 through 12, in increments of 2, are indicated. The yaxis is labeled “Energy, in million megawatthours,” and the numbers 700 through 820, in increments of 20, are indicated. There are 10 data points scattered in the form of a curve. The first data point begins approximately at the point with coordinates 1 comma 764. The points follow a path varying upward and downward and to the right, until reaching the point with coordinates of approximately 8 comma 806. The points then move downward and to the right, ending at the point with coordinates of approximately 10 comma 768.

The data represented by the points are as follows. Note that all values are approximate.

Point 1: 1 year, 764 million megawatt hours.

Point 2: 2 years, 788 million megawatt hours.

Point 3: 3 years, 781 million megawatt hours.

Point 4: 4 years, 785 million megawatt hours.

Point 5: 5 years, 804 million megawatt hours.

Point 6: 6 years, 803 million megawatt hours.

Point 7: 7 years, 796 million megawatt hours.

Point 8: 8 years, 806 million megawatt hours.

Point 9: 9 years, 790 million megawatt hours.

Point 10: 10 years, 768 million megawatt hours.

End skippable figure description.

Question 30.

Of the following equations, which best models the data in the preceding scatterplot?

31 / 38

31. Directions

For questions 31 through 38, solve the problem and enter your answer in the grid, as described below, on the answer sheet.

1. Although not required, it is suggested that you write your answer in the boxes at the top of the columns to help you fill in the circles accurately. You will receive credit only if the circles are filled in correctly.

2. Mark no more than one circle in any column.

3. No question has a negative answer.

4. Some problems may have more than one correct answer. In such cases, grid only one answer.

5. Mixed numbers such as must be gridded as 3.5 or 7/2. , is entered into the grid, it will be interpreted as   not

6. Decimal answers: If you obtain a decimal answer with more digits than the grid can accommodate, it may be either rounded or truncated, but it must fill the entire grid.

The following are four examples of how to record your answer in the spaces provided. Keep in mind that there are four spaces provided to record each answer.

Examples 1 and 2

Begin skippable figure description.

Example 1: If your answer is a fraction such as seventwelfths, it should be recorded as follows. Enter 7 in the first space, the fraction bar (a slash) in the second space, 1 in the third space, and 2 in the fourth space. All four spaces would be used in this example.

Example 2: If your answer is a decimal value such as 2.5, it could be recorded as follows. Enter 2 in the second space, the decimal point in the third space, and 5 in the fourth space. Only three spaces would be used in this example.

End skippable figure description.

Example 3


Begin skippable figure description.

Example 3: Acceptable ways to record twothirds are: 2 slash 3, .666, and .667. 

End skippable figure description.

Example 4


Note: You may start your answers in any column, space permitting. Columns you don’t need to use should be left blank.

Begin skippable figure description.

Example 4: It is not necessary to begin recording answers in the first space unless all four spaces are needed. For example, if your answer is 201, you may record 2 in the second space, 0 in the third space, and 1 in the fourth space. Alternatively, you may record 2 in the first space, 0 in the second space, and 1 in the third space. Spaces not needed should be left blank.

End skippable figure description.

Question 31.

A group of friends decided to divide the $800 cost of a trip equally among themselves. When two of the friends decided not to go on the trip, those remaining still divided the $800 cost equally, but each friend’s share of the cost increased by $20. How many friends were in the group originally?

32 / 38

32. Question 32 refers to the following equation.

  2 (5 x – 20) – (15 + 8 x) = 7

Question 32.

What value of x satisfies the preceding equation?

33 / 38

33. A laboratory supply company produces graduated cylinders, each with an internal radius of 2 inches and an internal height of 7.75 inches. What is one possible volume, rounded to the nearest cubic inch, of a graduated cylinder produced by this company?

34 / 38

34. In the x yplane, the graph o  intersects the graph of   y = x at the points   (0, 0) and   (aa). What is the value of a?

35 / 38

35. Question 35.

The line with the equation    is graphed in the x yplane. What is the xcoordinate of the xintercept of the line?

36 / 38

36. Question 36 refers to the following table.

Masses (kilograms)

Andrew

2.4

2.5

3.6

3.1

2.5

2.7

Maria

x

3.1

2.7

2.9

3.3

2.8

Question 36.

Andrew and Maria each collected six rocks, and the masses of the rocks are shown in the preceding table. The mean of the masses of the rocks Maria collected is 0.1 kilogram greater than the mean of the masses of the rocks Andrew collected. What is the value of x?

37 / 38

37. Jeremy deposited x dollars in his investment account on January 1, 2001. The amount of money in the account doubled each year until Jeremy had 480 dollars in his investment account on January 1, 2005. What is the value of x?

38 / 38

38. A school district is forming a committee to discuss plans for the construction of a new high school. Of those invited to join the committee, 15% are parents of students, 45% are teachers from the current high school, 25% are school and district administrators, and the remaining 6 individuals are students. How many more teachers were invited to join the committee than school and district administrators?

Shopping cart0
There are no products in the cart!
Continue shopping
0